
Turn on suggestions
Auto-suggest helps you quickly narrow down your search results by suggesting possible matches as you type.
Showing results for
Please log in to access translation
Turn on suggestions
Auto-suggest helps you quickly narrow down your search results by suggesting possible matches as you type.
Showing results for
Community Tip - New to the community? Learn how to post a question and get help from PTC and industry experts! X
Translate the entire conversation x
Please log in to access translation
Options
- Subscribe to RSS Feed
- Mark Topic as New
- Mark Topic as Read
- Float this Topic for Current User
- Bookmark
- Subscribe
- Mute
- Printer Friendly Page
graph curve manipulation
Apr 24, 2017
10:03 AM
- Mark as New
- Bookmark
- Subscribe
- Mute
- Subscribe to RSS Feed
- Permalink
- Notify Moderator
Please log in to access translation
Apr 24, 2017
10:03 AM
graph curve manipulation
Hi All,
I am trying to get a skewed bell curve to represent a chemical in a reaction via an equation. This first bell curve will be subtracted from another skewed bell curve that represents a second chemical in the reaction. I have tried many equation types and have settled on the one that I am currently using. The trouble is that I cannot manipulate the equation variables enough to attain the configuration that is needed.
Would you all inspect my equation and advise me on whether it can be edited to fit the Benchmark dots on the graph. Maybe another variable can be inserted into the equation? If, not, can you recommend a new equation? The curve slopes are not as critically important as the start, finish, and peak positions and values.
As of now, the starting(blue) and finishing(cyan) points are good. It is the peak(green) that must move to the right without sacrificing the other positions.
All help is very appreciated.
Thank you,
Gary
Mathcad 11
Solved! Go to Solution.
Labels:
- Labels:
-
Statistics_Analysis
ACCEPTED SOLUTION
Accepted Solutions
May 31, 2017
07:31 PM
- Mark as New
- Bookmark
- Subscribe
- Mute
- Subscribe to RSS Feed
- Permalink
- Notify Moderator
Please log in to access translation
May 31, 2017
07:31 PM
Hi All,
I have been working very hard on finalizing this issue. I had posted a file earlier(weeks ago) that at that time was going to be the one. Since then I have taken a closer look at a file that Luc posted that back then wasn't close enough to what I needed. I have made his method work great for me. I found that I also needed the variability that his methodology affords. I can easily move the nodes around by changing the node's x,y values.
I might also insert a 'node' at the lower left of the curve which would allow me to vary the upward onset; similar to what I did at the end of the curve with the downward finish.
I appreciate everyone's contributions as they all allowed me to open my thought process.
After the Mods approve this post, I will mark it as "answered".
Thank you All,
Gary
66 REPLIES 66
Apr 24, 2017
10:39 AM
- Mark as New
- Bookmark
- Subscribe
- Mute
- Subscribe to RSS Feed
- Permalink
- Notify Moderator
Please log in to access translation
Apr 24, 2017
10:39 AM
Unfortunately you forgot to atatch your worksheet.
To be able to attach files you will first switch to "Advanced Editor" (upoer right corner of edit window) and then you ar offered the option "attach" at the lower right.
Apr 24, 2017
11:51 AM
- Mark as New
- Bookmark
- Subscribe
- Mute
- Subscribe to RSS Feed
- Permalink
- Notify Moderator
Please log in to access translation
Apr 24, 2017
11:51 AM
Without seeing the sheet, a distribution function that is often used to mimic many kinds of distributions is the Beta distribution.
In a more elaborate form than what Mathcad provides, it is:

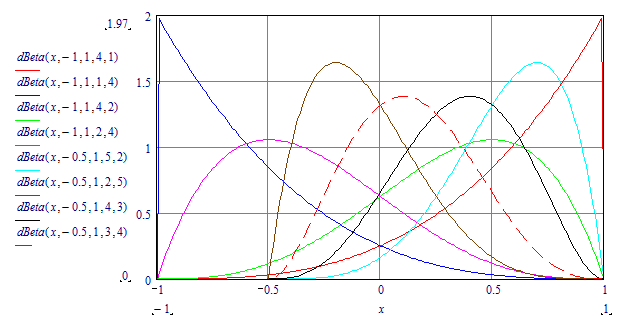
Hope this helps.
Success!
Luc
Apr 24, 2017
03:11 PM
- Mark as New
- Bookmark
- Subscribe
- Mute
- Subscribe to RSS Feed
- Permalink
- Notify Moderator
Please log in to access translation
Apr 24, 2017
03:11 PM
Thank you Werner Exinger and LucMeekes,
I did attach my file but somehow it did not get posted. I will now post it.
The dBeta function seems to not have the asymptotal style at both ends, but I will look at it.
Please have a look at the attached file and see if it can be changed to fit the benchmarks.
Thank you All,
Gary
Apr 24, 2017
03:52 PM
- Mark as New
- Bookmark
- Subscribe
- Mute
- Subscribe to RSS Feed
- Permalink
- Notify Moderator
Please log in to access translation
Apr 24, 2017
03:52 PM
Ah, with this kind of shape you will want to use the lognormal distribution. Why? Distribution Fitting - Chemical Yield Analysis
Use the dlnorm function. Here's an attempt:

You mention that you need asymptotes for the point t(i) and v(k). It would help if they're not exactly zero, but slightly positive.
Do you have more points along the curve?
Success!
Luc
Apr 24, 2017
04:35 PM
- Mark as New
- Bookmark
- Subscribe
- Mute
- Subscribe to RSS Feed
- Permalink
- Notify Moderator
Please log in to access translation
Apr 24, 2017
04:35 PM
Hi LucMeekes,
The top benchmark is very close but the other two have been squeezed into the middle. Can the left side be pushed back 60 points and the right side be pushed ahead 120 points; to the benchmarks? I did have the ln function in the equation. Please pardon me for not being heavy into the statistical jargon, although I am somewhat familiar with it.
I see that I should also include needing an equation that I can adopt into php coding. I don't know if php will accept dlnorm language?
I just read up on lognormal distribution and it just so happens that I did choose that equation after much trial and error. So my equation is the lognormal distribution, albeit in an edited state and a longer version than dlnorm.
Thank you for the link. I read it, understand it, and appreciate it.
RE: In my previous Reply, the file posted as a zip for some reason.
Gary
Apr 25, 2017
02:04 AM
- Mark as New
- Bookmark
- Subscribe
- Mute
- Subscribe to RSS Feed
- Permalink
- Notify Moderator
Please log in to access translation
Apr 25, 2017
02:04 AM
Sorry to say, but the two 'benchmarks' t(i) and v(k) are no good to accurately determine the curve. There are infinite possibilities to create a curve that hits the top u(j) and both t(i) and v(k) with different widths and skewness of the curve.
It would be much better defined if you had one point on each of the slopes of the curve instead, I'd guess ideally halfway the height so at a rate/level of about 500. But more datapoints would help even better.
Incidentally, I didn't choose the lognormal distribution by chance. I know that many biological processes closely match a lognomal distribution (e.g. the length of people), and specifically looked for an indication that chemical processes may be also well modelled with a lognormal distribution. That's where I found the article.
Luc
Apr 24, 2017
05:28 PM
- Mark as New
- Bookmark
- Subscribe
- Mute
- Subscribe to RSS Feed
- Permalink
- Notify Moderator
Please log in to access translation
Apr 24, 2017
05:28 PM
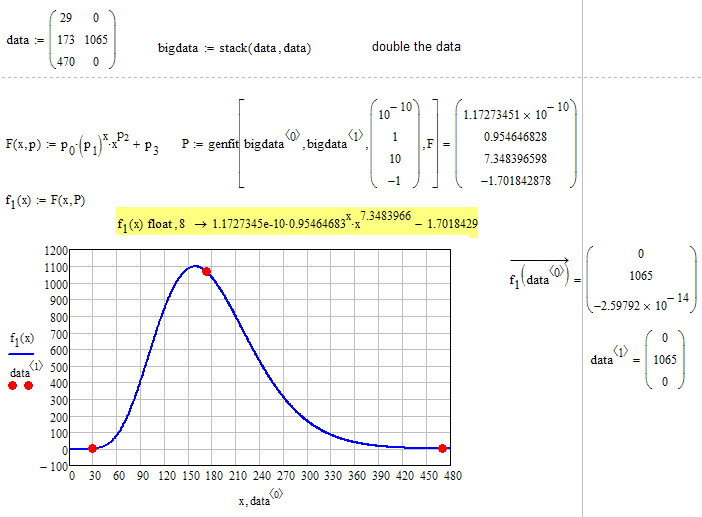
You have just three datapoints to fit - thats not much.
Her is one possible approach.
Apr 24, 2017
06:02 PM
- Mark as New
- Bookmark
- Subscribe
- Mute
- Subscribe to RSS Feed
- Permalink
- Notify Moderator
Please log in to access translation
Apr 24, 2017
06:02 PM
When I tried a dlnorm() fit of the curve on the three points, using a solve block, it (also) found the green dot somewhere on the slope instead of on the top.
It would be better if there were more points along the slopes.
The OP uses Mathcad 11, your attachment is 15, I guess...
Apr 24, 2017
06:24 PM
- Mark as New
- Bookmark
- Subscribe
- Mute
- Subscribe to RSS Feed
- Permalink
- Notify Moderator
Please log in to access translation
Apr 24, 2017
06:24 PM
Yes, just 3 data points is not satisfactory.
Forgot to save the worksheet im MC11 format. Here it is.
Hmmmm - thats strange! When I reopen the worksheet save in MC11 format, genfit throws an error (regression does not converge).
Opening the MC15 file all is OK.
So I added the values manually in this sheet.
Apr 24, 2017
06:56 PM
- Mark as New
- Bookmark
- Subscribe
- Mute
- Subscribe to RSS Feed
- Permalink
- Notify Moderator
Please log in to access translation
Apr 24, 2017
06:56 PM
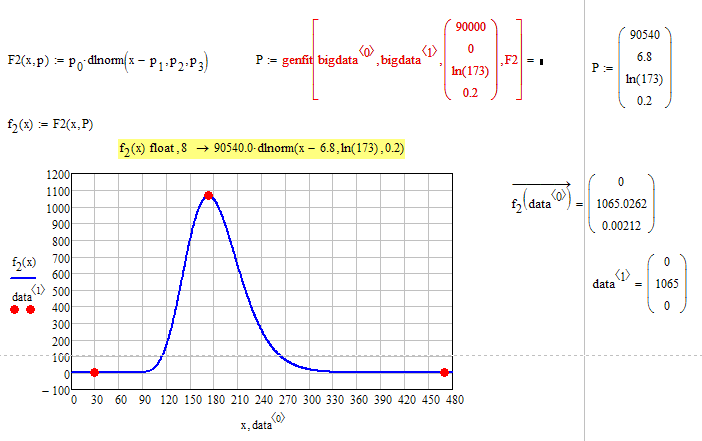
Here I played with dlnorm. values changed manually as genfit was not able to find a solution.
Apr 24, 2017
09:29 PM
- Mark as New
- Bookmark
- Subscribe
- Mute
- Subscribe to RSS Feed
- Permalink
- Notify Moderator
Please log in to access translation
Apr 24, 2017
09:29 PM
Hi Werner Exinger and LucMeekes,
The curve that uses the three data points in the 2:28 PM Reply looks great but I need data from 0 through 480. Can that worksheet be adopted to use x = 0,1 .. 480?
And, can the math be adopted to php coding? I don't know how compatible php is with Mathcad's shorthand.
Is there no variable or other function that could be added to my original equation that would push the left side further left while the peak is allowed to travel to the right; due to the left side and the peak generally moving together? I tried different log bases and many other iterations. Hopefully you or someone else will be able to recognize a possibility.
I appreciate your attentions very much.
Gary
Apr 25, 2017
11:39 AM
- Mark as New
- Bookmark
- Subscribe
- Mute
- Subscribe to RSS Feed
- Permalink
- Notify Moderator
Please log in to access translation
Apr 25, 2017
11:39 AM
Hi Werner Exinger and Luc and All,
I added a lognormal function at the beginning of my equation and have gotten very close. I am still tweaking although I feel I have reached the point of diminishing returns for this newer equation. I wish there was another function or variable that I could insert that would move the left slope to the left and move the peak to the right.
Gary
Apr 25, 2017
01:02 PM
- Mark as New
- Bookmark
- Subscribe
- Mute
- Subscribe to RSS Feed
- Permalink
- Notify Moderator
Please log in to access translation
Apr 25, 2017
03:10 PM
- Mark as New
- Bookmark
- Subscribe
- Mute
- Subscribe to RSS Feed
- Permalink
- Notify Moderator
Please log in to access translation
Apr 25, 2017
03:10 PM
Hey Werner Exinger and All,
That looks great! As I have Mathcad 11, I will copy your variables into my worksheet. Your notation is much neater and organized than mine so with your permission I will adopt your style.
I also arrived at a solution too. I introduced another variable of x into the base of the larger exponent. By doing this I am able to progressively increase the output at the end of the curve in a non-linear fashion and apparently slow the front part of the curve.
It will take some time to test yours as I have to use Win10 Virtual Disk to allow use of my Mathcad 11. PTC will not register it anymore as they unilaterally negated their contract with the legal owners of it. So I have a version of it on disk already that WinXP adapted to via the VDisk.
Gary
Apr 25, 2017
06:30 PM
- Mark as New
- Bookmark
- Subscribe
- Mute
- Subscribe to RSS Feed
- Permalink
- Notify Moderator
Please log in to access translation
Apr 25, 2017
06:30 PM
Sorry, I again forgot to save the file in MC11 format.
Here it is.
At the end you see how to get necessary parameters using "genfit".
But again, wehn I reopen the MC11 file, genfit fails.
If I set the algorithm used (right click an genfit) to the "optimizes LM" it works again.
Probably the optimized Levenberg Marquardt was not available in MC11 ?
Apr 26, 2017
06:22 AM
- Mark as New
- Bookmark
- Subscribe
- Mute
- Subscribe to RSS Feed
- Permalink
- Notify Moderator
Please log in to access translation
Apr 26, 2017
06:22 AM
Levenberg Marquardt was already available in Mathcad 6, if I remember well.
Mathcad 11 allows to choose the solving method.... for solve blocks. For genfit() the solving method is Levenberg-Marquardt, no other choice is possible.
If I open the sheet in Mathcad 11 I get an error on the 4th parameter of the call to genfit(): Mathcad claims it is undefined. Closer inspection reveals that g_ here is a 'variable' type, while its definition uses g_ as a 'constant' type. After that is aligned, Mathcad complains that there must be more data points than variables to solve for, which I think is a reasonable requirement.
Gary: Why aren't there more data points? If all you require is those three points, than a triangular shaped curved would do just as well! You must have more points if your intent is to find a bell-shaped skewed curve.
Luc
Apr 26, 2017
09:16 AM
- Mark as New
- Bookmark
- Subscribe
- Mute
- Subscribe to RSS Feed
- Permalink
- Notify Moderator
Please log in to access translation
Apr 26, 2017
09:16 AM
> Levenberg Marquardt was already available in Mathcad 6, if I remember well.
Yes but in MC15 I have the option for an Optimzed LM as well:
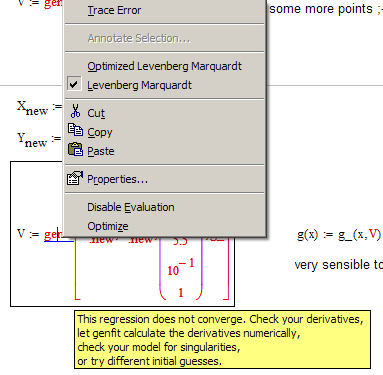
When I chose it, genfit provides the solution a had shown.
I have no idea why g_ is labeled as "constant" when defining that function and I have no idea why genfit works even though g_ is labeled as "variable" here. I would have expected the undefined error you describe.
> Mathcad complains that there must be more data points than variables to solve for
Yes, thats the error in the first call of "genfit" in my sheet (I made a comment about this in the file) and that also was the motivation for adding some (more or less) arbitrary additional points.
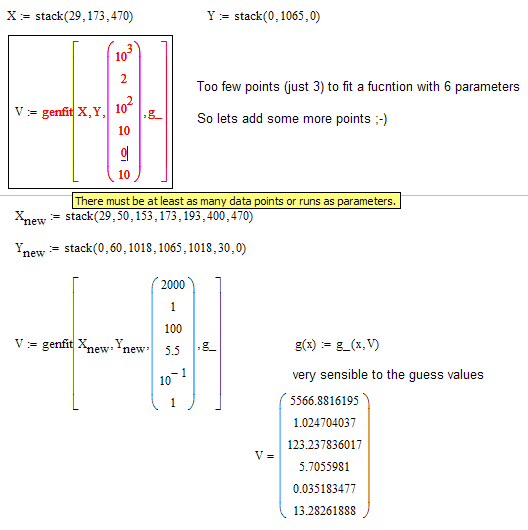
The whole thing is VERY sensible, not only concerning the guess values but also concerning the coordinates of those additionally added points.
Apr 26, 2017
10:27 AM
- Mark as New
- Bookmark
- Subscribe
- Mute
- Subscribe to RSS Feed
- Permalink
- Notify Moderator
Please log in to access translation
Apr 26, 2017
10:27 AM
I think instead of "VERY sensible" you meant to say "VERY sensitive".
With only the three data points given, I have my doubts about 'sensible'...
Luc
Apr 26, 2017
11:05 AM
- Mark as New
- Bookmark
- Subscribe
- Mute
- Subscribe to RSS Feed
- Permalink
- Notify Moderator
Please log in to access translation
Apr 26, 2017
11:05 AM

Yes, you are perfectly right!
Apr 26, 2017
11:11 AM
- Mark as New
- Bookmark
- Subscribe
- Mute
- Subscribe to RSS Feed
- Permalink
- Notify Moderator
Please log in to access translation
Apr 26, 2017
11:11 AM
Hi Luc and All,
There are more than 3 data points; x = 0, 1 .. 480. The 3 points that I call out are only benchmarks made to denote the start, the peak, and the end of the skewed bell curve.
Please pardon my Mathcad ignorance but I am not familiar with genfit. Can genfit be converted into an equation that will insert into php?
Once again, thank you very much for all of your attentions.
Gary
Apr 26, 2017
11:30 AM
- Mark as New
- Bookmark
- Subscribe
- Mute
- Subscribe to RSS Feed
- Permalink
- Notify Moderator
Please log in to access translation
Apr 26, 2017
11:30 AM
With datapoints we mean what you call benchmarks. Points you want to fit a certain function to.
With only start, peak and end its hard to fit a suitable bell curve. You can also fit a perfect paraobola to run through those 3 points.
As you see I had added a few other points to your three before I tried with your function (slightly modified by adding a parameter for vertical offset.
You could also use a solveblock with minerr (or even minimize) to get the "optimal" parameters mimizing the sum of squares of the errors. (least squares fit).
You can also see the equation using the symbolic evaluation.
The region with V:V= ist mandatory to get a meaningful symbolic result :
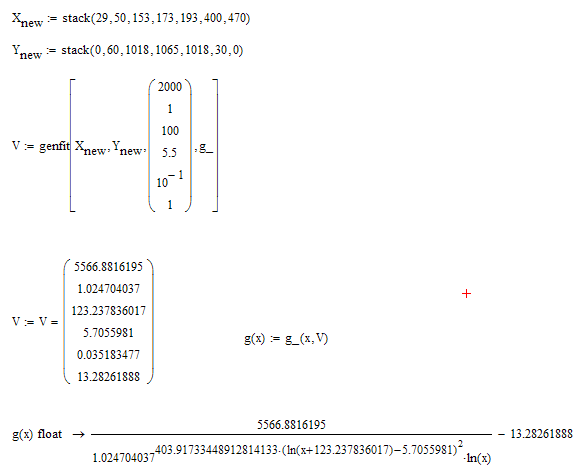
Apr 26, 2017
11:25 AM
- Mark as New
- Bookmark
- Subscribe
- Mute
- Subscribe to RSS Feed
- Permalink
- Notify Moderator
Please log in to access translation
Apr 26, 2017
11:25 AM
Hi Werner Exinger and All,
Your configuration was close but did not fit. The variable var6 at the end of the equation disrupts the start of the equation. It needs to start at 0 and it CAN end at a non-0 number, as long as it is close to zero(preferably under 5). I was working on this last night. I managed to zero in on my version again but it is still not acceptable.
You and Luc are impressive with your knowledge of math and Mathcad. I have only infrequently messed with both. The last time I used heavier math was in college in Calculus II, Physics, and Engineering Chemistry. I have since forgotten most of it.
Gary
Apr 26, 2017
02:46 PM
- Mark as New
- Bookmark
- Subscribe
- Mute
- Subscribe to RSS Feed
- Permalink
- Notify Moderator
Please log in to access translation
Apr 26, 2017
02:46 PM
> It needs to start at 0 and it CAN end at a non-0 number, as long as it is close to zero(preferably under 5).
OK, thats new information. Anything else about additional constraints you can tell us?
If f(29)=0 we dont have an asymptotic behaviour as you demanded earlier. Did you mean the the slope at 29 should be zero?
Is it mandatory that the f(173) is exactly 1065?
Is it mandatory that at 173 we have the absolute peak, meaning the slope is zero there?
....
Simple polynomials might do all of the above!
Apr 26, 2017
04:01 PM
- Mark as New
- Bookmark
- Subscribe
- Mute
- Subscribe to RSS Feed
- Permalink
- Notify Moderator
Please log in to access translation
Apr 26, 2017
04:01 PM
Here is what looks like a perfect fit, given the conditions you gave so far:
Apr 26, 2017
04:09 PM
- Mark as New
- Bookmark
- Subscribe
- Mute
- Subscribe to RSS Feed
- Permalink
- Notify Moderator
Please log in to access translation
Apr 26, 2017
11:42 PM
- Mark as New
- Bookmark
- Subscribe
- Mute
- Subscribe to RSS Feed
- Permalink
- Notify Moderator
Please log in to access translation
Apr 26, 2017
11:42 PM
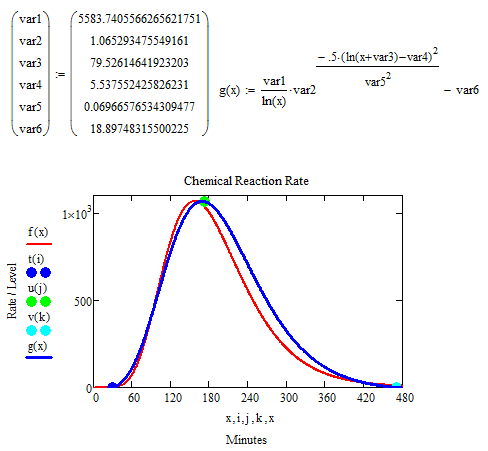
Hi Werner Exinger, Luc, and All,
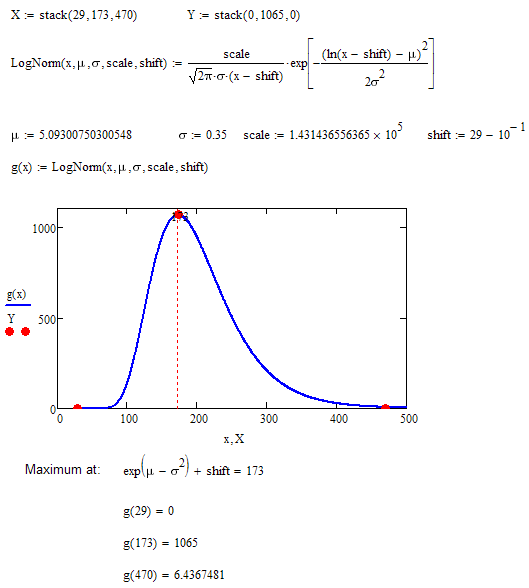
I finally tweaked it to where I can use it. I appreciate your work as you pushed me to innovate the original equation. Here is the result.
The benchmarks are the only spots where I needed a large degree of accuracy. The left and right slopes can generally be anything as long as they go up and then down smoothly. As x = 0, 1 .. 480, 29 is where the curve accelerates upward, 173 is the peak, and 470 is where the curve levels off.
Thank very much Werner Exinger, Luc,and All.
Gary
Apr 27, 2017
02:16 PM
- Mark as New
- Bookmark
- Subscribe
- Mute
- Subscribe to RSS Feed
- Permalink
- Notify Moderator
Please log in to access translation
Apr 27, 2017
02:16 PM
> The benchmarks are the only spots where I needed a large degree of accuracy. The left and right slopes can generally be anything as long as they go up and then down smoothly.
Thats not much you damand for 😉
Then simple polynomials (chemical processes usually don't follow polynomials) would have done the job as well!?
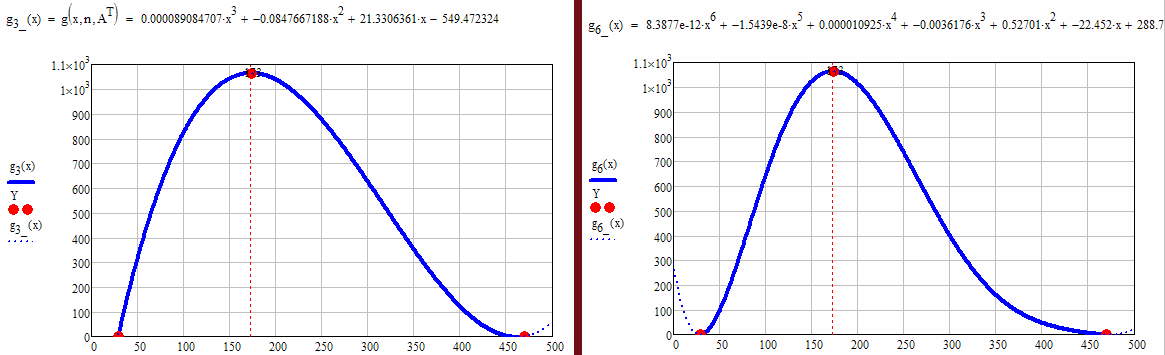
Here polynomials of third and sixth order. The provide not just an approximation but a perfect fit at your benchmarks and the polynomial of sixth order provides a slope of zero at all three benchmarks. You never answered the question as to if this would be important to you.
Apr 27, 2017
03:55 PM
- Mark as New
- Bookmark
- Subscribe
- Mute
- Subscribe to RSS Feed
- Permalink
- Notify Moderator
Please log in to access translation
Apr 27, 2017
03:55 PM
Hi Werner Exinger and All,
I could not get your graphs to work and I could not get your equation, g(x), to graph when I entered it in myself either. I got a positive and a negative array of results. The g6(x) graph looked like it could work with a more asymptotic start to it and a start at 0 and and ending at 480. x must equal 0,1 .. 480.
I did explain three or four times about the benchmarks but maybe I did not translate and explain them fully. I wish that I had.
I have trouble with your shorthand as I am not as good in Mathcad as you are. I relate to the longer equation. I know that is not efficient but I am not experienced enough.
Thank you very, very much for your contributions and Luc's too. I hope that I can be of assistance to you someday.
Gary
May 01, 2017
03:46 PM
- Mark as New
- Bookmark
- Subscribe
- Mute
- Subscribe to RSS Feed
- Permalink
- Notify Moderator
Please log in to access translation
May 01, 2017
03:46 PM
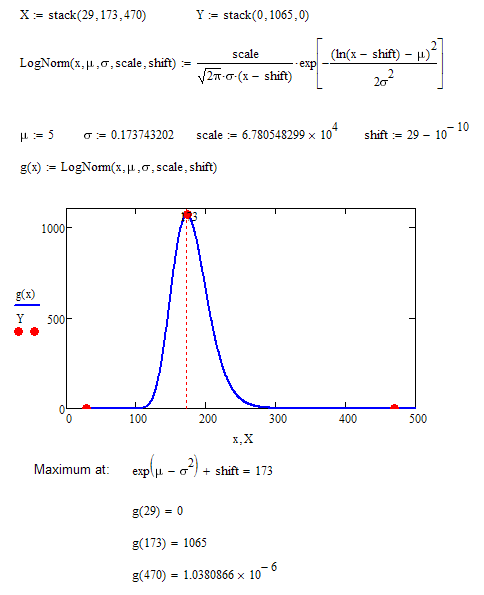
With just these three points, and a desire for smooth transition, this is a viable solution:
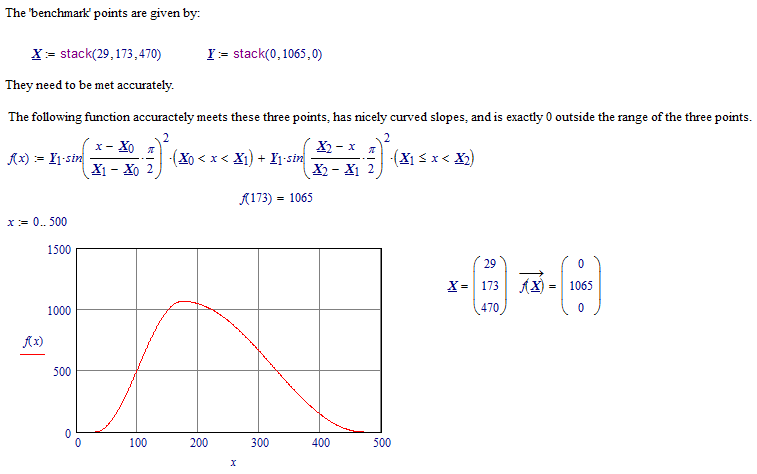
Luc


