
Turn on suggestions
Auto-suggest helps you quickly narrow down your search results by suggesting possible matches as you type.
Showing results for
Please log in to access translation
Turn on suggestions
Auto-suggest helps you quickly narrow down your search results by suggesting possible matches as you type.
Showing results for
Community Tip - Need to share some code when posting a question or reply? Make sure to use the "Insert code sample" menu option. Learn more! X
Translate the entire conversation x
Please log in to access translation
Options
- Subscribe to RSS Feed
- Mark Topic as New
- Mark Topic as Read
- Float this Topic for Current User
- Bookmark
- Subscribe
- Mute
- Printer Friendly Page
help with plotting piecewise function
May 17, 2019
09:24 AM
- Mark as New
- Bookmark
- Subscribe
- Mute
- Subscribe to RSS Feed
- Permalink
- Notify Moderator
Please log in to access translation
May 17, 2019
09:24 AM
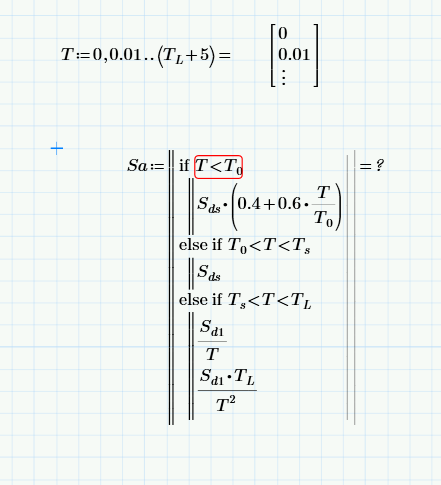
help with plotting piecewise function
Hi, can someone help me, I cannot figure out what I am doing wrong in this. The error I get is that the value must be a scalar.

Solved! Go to Solution.
Labels:
- Labels:
-
Civil_Engineering
-
Programming
ACCEPTED SOLUTION
Accepted Solutions
May 17, 2019
01:20 PM
- Mark as New
- Bookmark
- Subscribe
- Mute
- Subscribe to RSS Feed
- Permalink
- Notify Moderator
Please log in to access translation
May 17, 2019
01:20 PM

6 REPLIES 6
May 17, 2019
10:01 AM
- Mark as New
- Bookmark
- Subscribe
- Mute
- Subscribe to RSS Feed
- Permalink
- Notify Moderator
Please log in to access translation
May 17, 2019
10:01 AM
Hi,
Because you have not included the Prime sheet I have expressed the function in terms of all the input values.
Not sure if you are using Prime 15 or 14?
In your sheet T is a range variable so the comparison with a single variable T0 cannot be done.

Cheers
Terry
May 17, 2019
10:11 AM
- Mark as New
- Bookmark
- Subscribe
- Mute
- Subscribe to RSS Feed
- Permalink
- Notify Moderator
Please log in to access translation
May 17, 2019
10:11 AM
Hi Terry, I'm using Prime 5 and I'm ultimately trying to plot the piecewise function that I was attempting to define with the code posted. I made those changes, but it still is not working. T0 is a single value, where T is an array, I tried a while loop to populate Sa but I could not get that to work either. I'm just trying to populate Sa with values and then plot Sa and T.
May 17, 2019
11:22 AM
- Mark as New
- Bookmark
- Subscribe
- Mute
- Subscribe to RSS Feed
- Permalink
- Notify Moderator
Please log in to access translation
May 17, 2019
11:22 AM
Hi
Here is the plot with some values assigned to the variables. T is a vector of values.

May 17, 2019
01:20 PM
- Mark as New
- Bookmark
- Subscribe
- Mute
- Subscribe to RSS Feed
- Permalink
- Notify Moderator
Please log in to access translation
May 17, 2019
01:20 PM
Hi,
Here is chart using the Chart Component of Prime5
May 17, 2019
01:45 PM
- Mark as New
- Bookmark
- Subscribe
- Mute
- Subscribe to RSS Feed
- Permalink
- Notify Moderator
Please log in to access translation
May 17, 2019
01:45 PM
Not sure if you are using Prime 15 or 14?
Wow! You sure are far ahead of your time 🙂
May 17, 2019
10:09 AM
- Mark as New
- Bookmark
- Subscribe
- Mute
- Subscribe to RSS Feed
- Permalink
- Notify Moderator
Please log in to access translation
May 17, 2019
10:09 AM
Hi,
Forgot you also need to include what happens when T is equal to the comparison boundary limits.
Here is one way.

Cheers


