
Turn on suggestions
Auto-suggest helps you quickly narrow down your search results by suggesting possible matches as you type.
Showing results for
Please log in to access translation
Turn on suggestions
Auto-suggest helps you quickly narrow down your search results by suggesting possible matches as you type.
Showing results for
Community Tip - Learn all about the Community Ranking System, a fun gamification element of the PTC Community. X
Translate the entire conversation x
Please log in to access translation
Options
- Subscribe to RSS Feed
- Mark Topic as New
- Mark Topic as Read
- Float this Topic for Current User
- Bookmark
- Subscribe
- Mute
- Printer Friendly Page
histogram
Jan 08, 2014
08:11 PM
- Mark as New
- Bookmark
- Subscribe
- Mute
- Subscribe to RSS Feed
- Permalink
- Notify Moderator
Please log in to access translation
Jan 08, 2014
08:11 PM
histogram
I have these two sets of data one a vector being the length of particles(L),and the other a vector of the number of particles of a particular length(N). I can plot N versus L alright but the problem is the points in L are not equally spaced, therefore the N (Vs.)L plot is not exactly a histogram. My question is how to convert these two sets of data into a histogram?
making a single vector out of L and N ( a vector of length where each particular Li is repeated Ni times) is out of question since the elements in N are in the order of millions and the produced vector will be bigger than what mathcad can handle.
Solved! Go to Solution.
Labels:
- Labels:
-
Statistics_Analysis
ACCEPTED SOLUTION
Accepted Solutions
Jan 10, 2014
01:44 PM
- Mark as New
- Bookmark
- Subscribe
- Mute
- Subscribe to RSS Feed
- Permalink
- Notify Moderator
Please log in to access translation
Jan 10, 2014
01:44 PM
So here is a third version of mk_histo(). A very little bit slower (noticable only with big vector v and a high number of intervals). This time the third parameter can either be a positive integer or a vector with interval limits. Same meaning as the first parameter in the built in functions hist() and histogram().
14 REPLIES 14
Jan 08, 2014
08:36 PM
- Mark as New
- Bookmark
- Subscribe
- Mute
- Subscribe to RSS Feed
- Permalink
- Notify Moderator
Please log in to access translation
Jan 08, 2014
08:36 PM
The Mathcad functions hist() and histogram() wont work for you unless you create the big combined vector you described. So I guess you will have to write a small program to do what you want.
Maybe you set up and post a demo wirksheet with dummy data (does not need to be the millions values you described) and state what kind of histogram you expect.
Jan 09, 2014
01:41 PM
- Mark as New
- Bookmark
- Subscribe
- Mute
- Subscribe to RSS Feed
- Permalink
- Notify Moderator
Please log in to access translation
Jan 09, 2014
01:41 PM
Werner Exinger wrote:
Maybe you set up and post a demo...
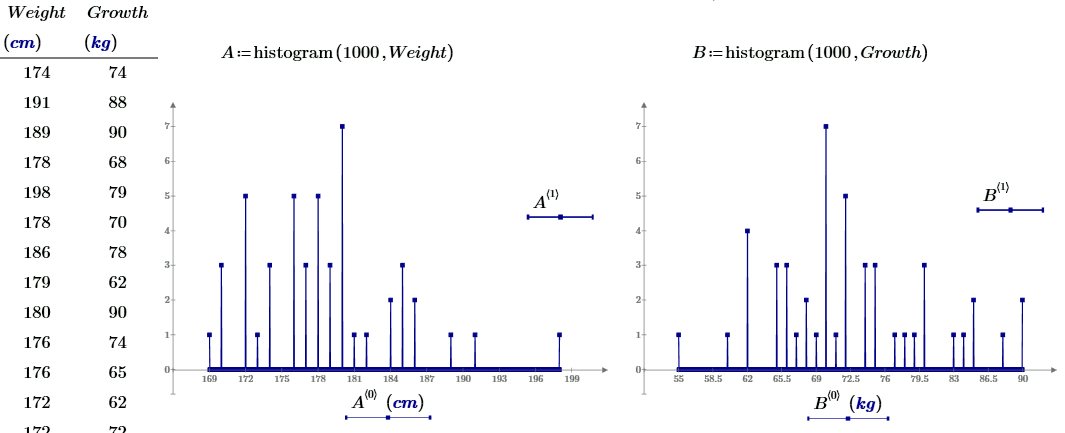
I can only this way to create a histogram in Prime 
Do you know one better way?
(About this task - http://communities.ptc.com/videos/3543)
Jan 09, 2014
02:17 PM
- Mark as New
- Bookmark
- Subscribe
- Mute
- Subscribe to RSS Feed
- Permalink
- Notify Moderator
Please log in to access translation
Jan 09, 2014
02:17 PM
I can only this way to create a histogram in Prime
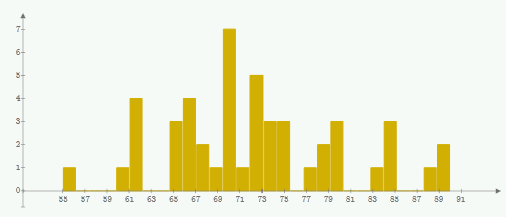
Unfortunately MortezaA cannot use histogram(), like you suggested, because he is not able to create the necessary datavector, as he wrote. To explain it with your example (btw, your column headers are interchanged): you have one vector with all possible heights and a second one with the number of people being that tall. The values in the first vector are not equally spaced and so the two vectors do not apply for a true histogram.
In your example you have a dataset with only 48 samples and are creating a histogram with 1000 bins!?? Also I think that plot type "column trace" is more suitable for histogram plots that the "line trace" in your sheet.
I don't know what Mortezaa expects from the histogram and in which format he would need the histo-data as a result, but I guess he is in need for something like the following (I am assuming people are using real Mathcad unless otherwise stated):
Jan 09, 2014
06:05 PM
- Mark as New
- Bookmark
- Subscribe
- Mute
- Subscribe to RSS Feed
- Permalink
- Notify Moderator
Please log in to access translation
Jan 09, 2014
06:05 PM
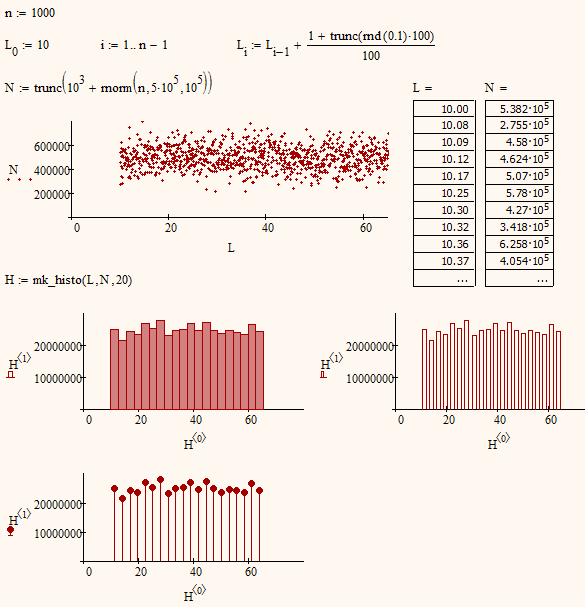
I believe a histogram like what you made out of your L and N (where both L and N are not equally spaced) is what I'm looking for .
Just one question .what is that mk_histo(L,N,20) ?
it appears it is not a defined function in mathcad.( at least in mine!!)
Jan 09, 2014
06:17 PM
- Mark as New
- Bookmark
- Subscribe
- Mute
- Subscribe to RSS Feed
- Permalink
- Notify Moderator
Please log in to access translation
Jan 09, 2014
06:17 PM
Just one question .what is that mk_histo(L,N,20) ?
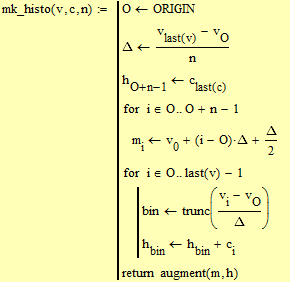
Just as I wrote before - I don't think that the built-in functions can do what you want. A small self written routine is necessary. Thats what mk_histo (aka make histogram) is - a routine I wrote to do what I thought you needed. Here is the file.
First parameter (v) of the routine ist a vector with the values you want to categorize your data for. Its the particle length in your problem (I had "values" in mind, so the v). The second parameter is a corresponding vector with the number of particles ("count" --> c). v and c must be vectors of same dimension - its a quick hack and so there is no error checking built in. The third parameter "n" is the number of intervals you want your data sorted in. The range [min(v); max(v)] is divided in n intervals of equal length. With exception of the first interval the lower end of each interval counts for the preceding interval, so it counts all occurencies of lower<value<=upper.
The output of the routine is a n x 2 matrix.The first column contains the midpoints of the intervals. The second column represents the frequencies with which values in data fall into the intervals.
In contrast to histogram() "n" must be an integer (in histogram() and hist() it could also be a vector with interval endpoints).
Jan 09, 2014
08:01 PM
- Mark as New
- Bookmark
- Subscribe
- Mute
- Subscribe to RSS Feed
- Permalink
- Notify Moderator
Please log in to access translation
Jan 09, 2014
08:01 PM
The first mk_hist() choked on same rare occasions because of round off errors, so I rewrote it - shorter, more to the point and more reliable (I hope).This time it was more convenient to chose lower<=value<upper (exception is the last interval, of course).
Jan 10, 2014
02:31 AM
- Mark as New
- Bookmark
- Subscribe
- Mute
- Subscribe to RSS Feed
- Permalink
- Notify Moderator
Please log in to access translation
Jan 10, 2014
02:31 AM
Werner Exinger wrote:
I can only this way to create a histogram in Prime
In your example you have a dataset with only 48 samples and are creating a histogram with 1000 bins!?? Also I think that plot type "column trace" is more suitable for histogram plots that the "line trace" in your sheet.
Thanks, but no other way to plot a histogram in Prime 
Jan 10, 2014
04:08 AM
- Mark as New
- Bookmark
- Subscribe
- Mute
- Subscribe to RSS Feed
- Permalink
- Notify Moderator
Please log in to access translation
Jan 10, 2014
04:08 AM
Valery Ochkov wrote:
Thanks, but no other way to plot a histogram in Prime
"Column trace" IS available in Prime and I see no reason why my self written program should not work in Prime. Plotting a histogram never was something special in Mathcad as long as we could format a plot as bar plot (or "column trace" in Prime). Its the creation of the necessary vectors which was the problem in this thread as Mathcad does not offer something suitable on its own.
Jan 10, 2014
06:05 AM
- Mark as New
- Bookmark
- Subscribe
- Mute
- Subscribe to RSS Feed
- Permalink
- Notify Moderator
Please log in to access translation
Jan 10, 2014
06:05 AM
Werner Exinger wrote:
Valery Ochkov wrote:
Thanks, but no other way to plot a histogram in Prime
"Column trace" IS available in Prime
Thanks, now I see!
But I can not correct edit numbers on the X scale
Jan 10, 2014
07:03 AM
- Mark as New
- Bookmark
- Subscribe
- Mute
- Subscribe to RSS Feed
- Permalink
- Notify Moderator
Please log in to access translation
Jan 10, 2014
07:03 AM
Valery Ochkov wrote:
But I can not correct edit numbers on the X scale
You CAN apply a better and more appropriate scale (either have the ticks at the center of the intervals or at their ends), but its unnecessarily complicated to do so and has some quirks (See attached file).
Neither mathcad nor Prime can do that out of the box but IMHO they should.
Plots in Mathcad never were really top notch with a serious need for improvements, but Primes plots are incredibly worse in most respects und much more uncomfortable to handle!
Jan 10, 2014
07:31 AM
- Mark as New
- Bookmark
- Subscribe
- Mute
- Subscribe to RSS Feed
- Permalink
- Notify Moderator
Please log in to access translation
Jan 10, 2014
07:31 AM
Jan 10, 2014
07:42 AM
- Mark as New
- Bookmark
- Subscribe
- Mute
- Subscribe to RSS Feed
- Permalink
- Notify Moderator
Please log in to access translation
Jan 10, 2014
07:42 AM
Sorry, I don't understand what you mean.
Are you after integer scale values? That shouldn't be that difficult but is IMO not appropriate for a histogram - at least nor for one with just a few bins..
Jan 10, 2014
11:33 AM
- Mark as New
- Bookmark
- Subscribe
- Mute
- Subscribe to RSS Feed
- Permalink
- Notify Moderator
Please log in to access translation
Jan 10, 2014
11:33 AM
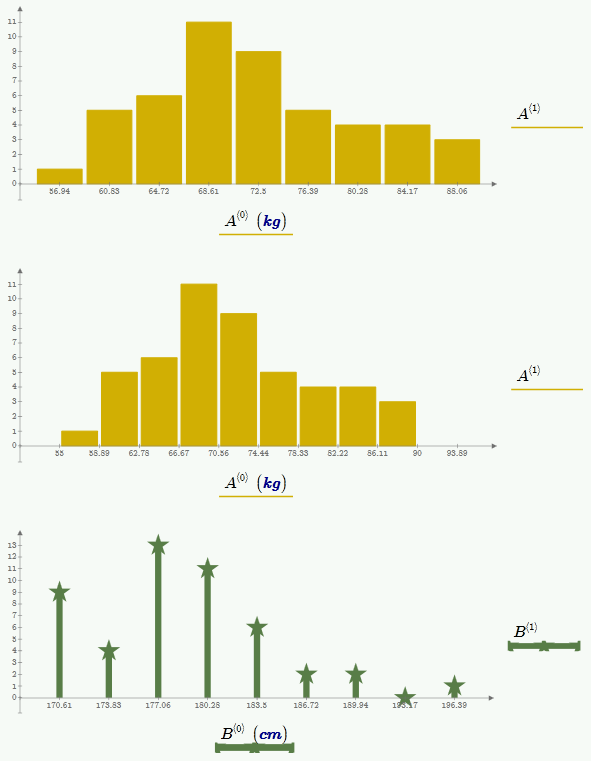
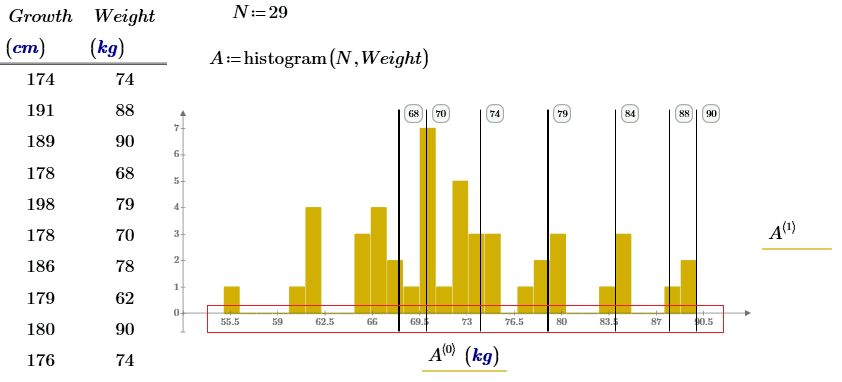
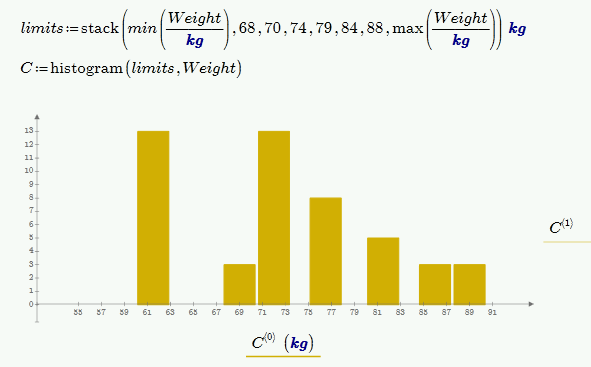
Still not sure what you are looking for, Valery. Do you rather have in mind a histogram with intervals of different length? Are the values you marked in your plot the upper interval limits? Thats fairly easy to do, again using histogram(). But this time it seems impossible to get axis tick values at interval midpoints or interval endpoints, as Prime only allows for equidistant ticks.
We may indicate the interval length/limits by drawing boxes:
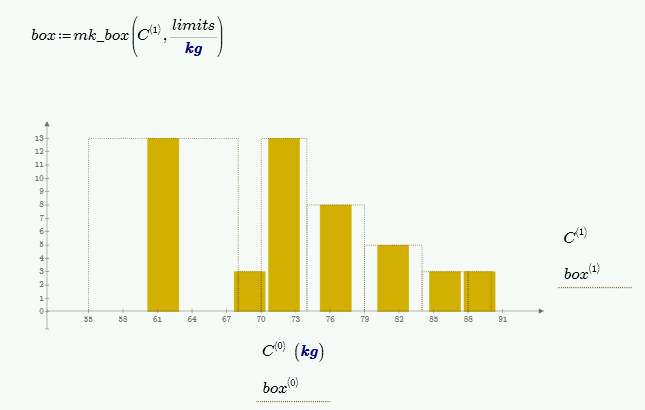
But I think its OK that Prime draws every bar of equal width. That way the area of the bars are comparable and its the area we perceive when we look at that kind of plot.
Jan 10, 2014
01:44 PM
- Mark as New
- Bookmark
- Subscribe
- Mute
- Subscribe to RSS Feed
- Permalink
- Notify Moderator
Please log in to access translation
Jan 10, 2014
01:44 PM
So here is a third version of mk_histo(). A very little bit slower (noticable only with big vector v and a high number of intervals). This time the third parameter can either be a positive integer or a vector with interval limits. Same meaning as the first parameter in the built in functions hist() and histogram().


