Turn on suggestions
Auto-suggest helps you quickly narrow down your search results by suggesting possible matches as you type.
Showing results for
Please log in to access translation
Turn on suggestions
Auto-suggest helps you quickly narrow down your search results by suggesting possible matches as you type.
Showing results for
Community Tip - When posting, your subject should be specific and summarize your question. Here are some additional tips on asking a great question. X
Translate the entire conversation x
Please log in to access translation
Options
- Subscribe to RSS Feed
- Mark Topic as New
- Mark Topic as Read
- Float this Topic for Current User
- Bookmark
- Subscribe
- Mute
- Printer Friendly Page
plotting 3d experimental data
Feb 12, 2013
01:30 PM
- Mark as New
- Bookmark
- Subscribe
- Mute
- Subscribe to RSS Feed
- Permalink
- Notify Moderator
Please log in to access translation
Feb 12, 2013
01:30 PM
plotting 3d experimental data
I'm fairly new to mathcad, but few hours of attemts did not yield any positive results.
Thing i'm tryin to do, is plotting Voltage fluctuation spectral density against frequency And temperature.
So it would be x - freq, y - temp, and z - voltage.
Problem arises as 1) theese values are distributed non-uniformly.
2) i could really use log scale on x axis.
Typical matrix or 3 vectors view cant really help, because my axis are plotted as integers.
I also had an idea of plotting several x,z curves with changing y parameter, but mathcad does not allow it.
Any tips?
Solved! Go to Solution.
Labels:
- Labels:
-
Statistics_Analysis
ACCEPTED SOLUTION
Accepted Solutions
Feb 12, 2013
02:00 PM
- Mark as New
- Bookmark
- Subscribe
- Mute
- Subscribe to RSS Feed
- Permalink
- Notify Moderator
Please log in to access translation
Feb 12, 2013
02:00 PM
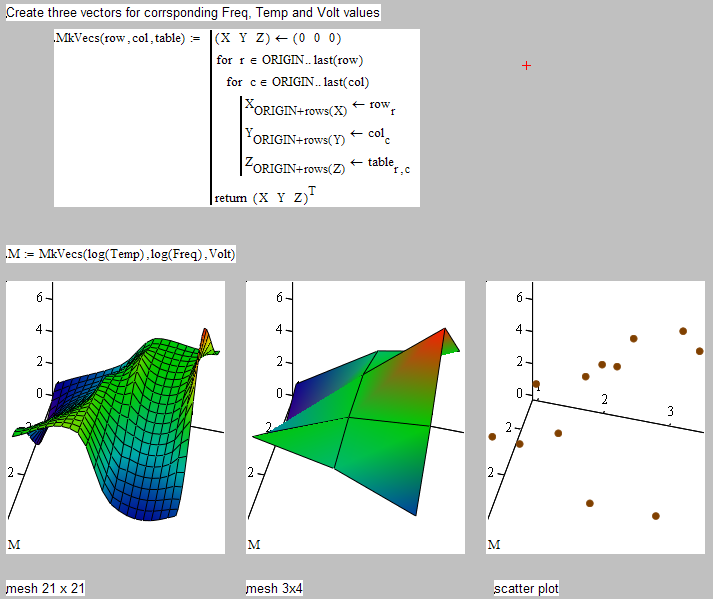
Does the attached help? Basically, you create 2 conformable matrices with your frequency and temperature data (one vector being replicated across the columns and the other down the rows) then plot the 3 resulting matrices using parentheses to group them together.
Stuart
3 REPLIES 3
Feb 12, 2013
02:00 PM
- Mark as New
- Bookmark
- Subscribe
- Mute
- Subscribe to RSS Feed
- Permalink
- Notify Moderator
Please log in to access translation
Feb 12, 2013
02:00 PM
Does the attached help? Basically, you create 2 conformable matrices with your frequency and temperature data (one vector being replicated across the columns and the other down the rows) then plot the 3 resulting matrices using parentheses to group them together.
Stuart
Feb 12, 2013
02:32 PM
- Mark as New
- Bookmark
- Subscribe
- Mute
- Subscribe to RSS Feed
- Permalink
- Notify Moderator
Please log in to access translation
Feb 12, 2013
02:32 PM
Thats amazing, i am yet to grasp the mechanics of it, but thats exactly what i needed.
I appreciate it
Feb 12, 2013
02:52 PM
- Mark as New
- Bookmark
- Subscribe
- Mute
- Subscribe to RSS Feed
- Permalink
- Notify Moderator
Please log in to access translation