Community Tip - You can subscribe to a forum, label or individual post and receive email notifications when someone posts a new topic or reply. Learn more! X
- Subscribe to RSS Feed
- Mark Topic as New
- Mark Topic as Read
- Float this Topic for Current User
- Bookmark
- Subscribe
- Mute
- Printer Friendly Page
problem with 3D function plotting
- Mark as New
- Bookmark
- Subscribe
- Mute
- Subscribe to RSS Feed
- Permalink
- Notify Moderator
problem with 3D function plotting
Hi everyone!
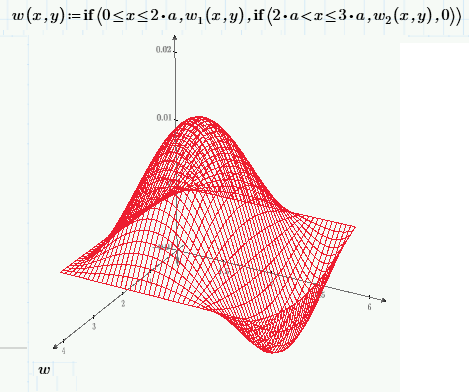
I have a problem with 3D plotting of function and I have no idea why it occurs!
My function contains two of them: w1(x,y) and w2(x,y) and in fact w2(x,y) is 0.
w1(x,y) is in range of 0<x<2a
w2(x,y) is in range of 2a<x<3a
2D Contour plot looks quite good but mathcad says that 3D plot cannot be executed because it doesn't evaluate to real number.
What is curious, the program doesn't have problems with 3D plotting of neither w1(x,y) nor w2(x,y).
I've attached the file.
Any ideas?
I would appreciate any solution.
regards
koffaleq
Solved! Go to Solution.
Accepted Solutions
- Mark as New
- Bookmark
- Subscribe
- Mute
- Subscribe to RSS Feed
- Permalink
- Notify Moderator
- Mark as New
- Bookmark
- Subscribe
- Mute
- Subscribe to RSS Feed
- Permalink
- Notify Moderator
Add 2 more line to your w
else
return 0
and you are fine
because w is not defined out of [0,3a], 3D plot returns error in those region, so just say it is zero. Or use NaN, not a number, but then your contour plot does not work with NaN, 3d plot works with NaN though
- Mark as New
- Bookmark
- Subscribe
- Mute
- Subscribe to RSS Feed
- Permalink
- Notify Moderator

- Mark as New
- Bookmark
- Subscribe
- Mute
- Subscribe to RSS Feed
- Permalink
- Notify Moderator
thanks a lot


