Turn on suggestions
Auto-suggest helps you quickly narrow down your search results by suggesting possible matches as you type.
Showing results for
Please log in to access translation
Turn on suggestions
Auto-suggest helps you quickly narrow down your search results by suggesting possible matches as you type.
Showing results for
Community Tip - You can change your system assigned username to something more personal in your community settings. X
Translate the entire conversation x
Please log in to access translation
Options
- Subscribe to RSS Feed
- Mark Topic as New
- Mark Topic as Read
- Float this Topic for Current User
- Bookmark
- Subscribe
- Mute
- Printer Friendly Page
range of the radio (a)
Oct 07, 2016
05:35 PM
- Mark as New
- Bookmark
- Subscribe
- Mute
- Subscribe to RSS Feed
- Permalink
- Notify Moderator
Please log in to access translation
Oct 07, 2016
05:35 PM
range of the radio (a)
Hello everyone
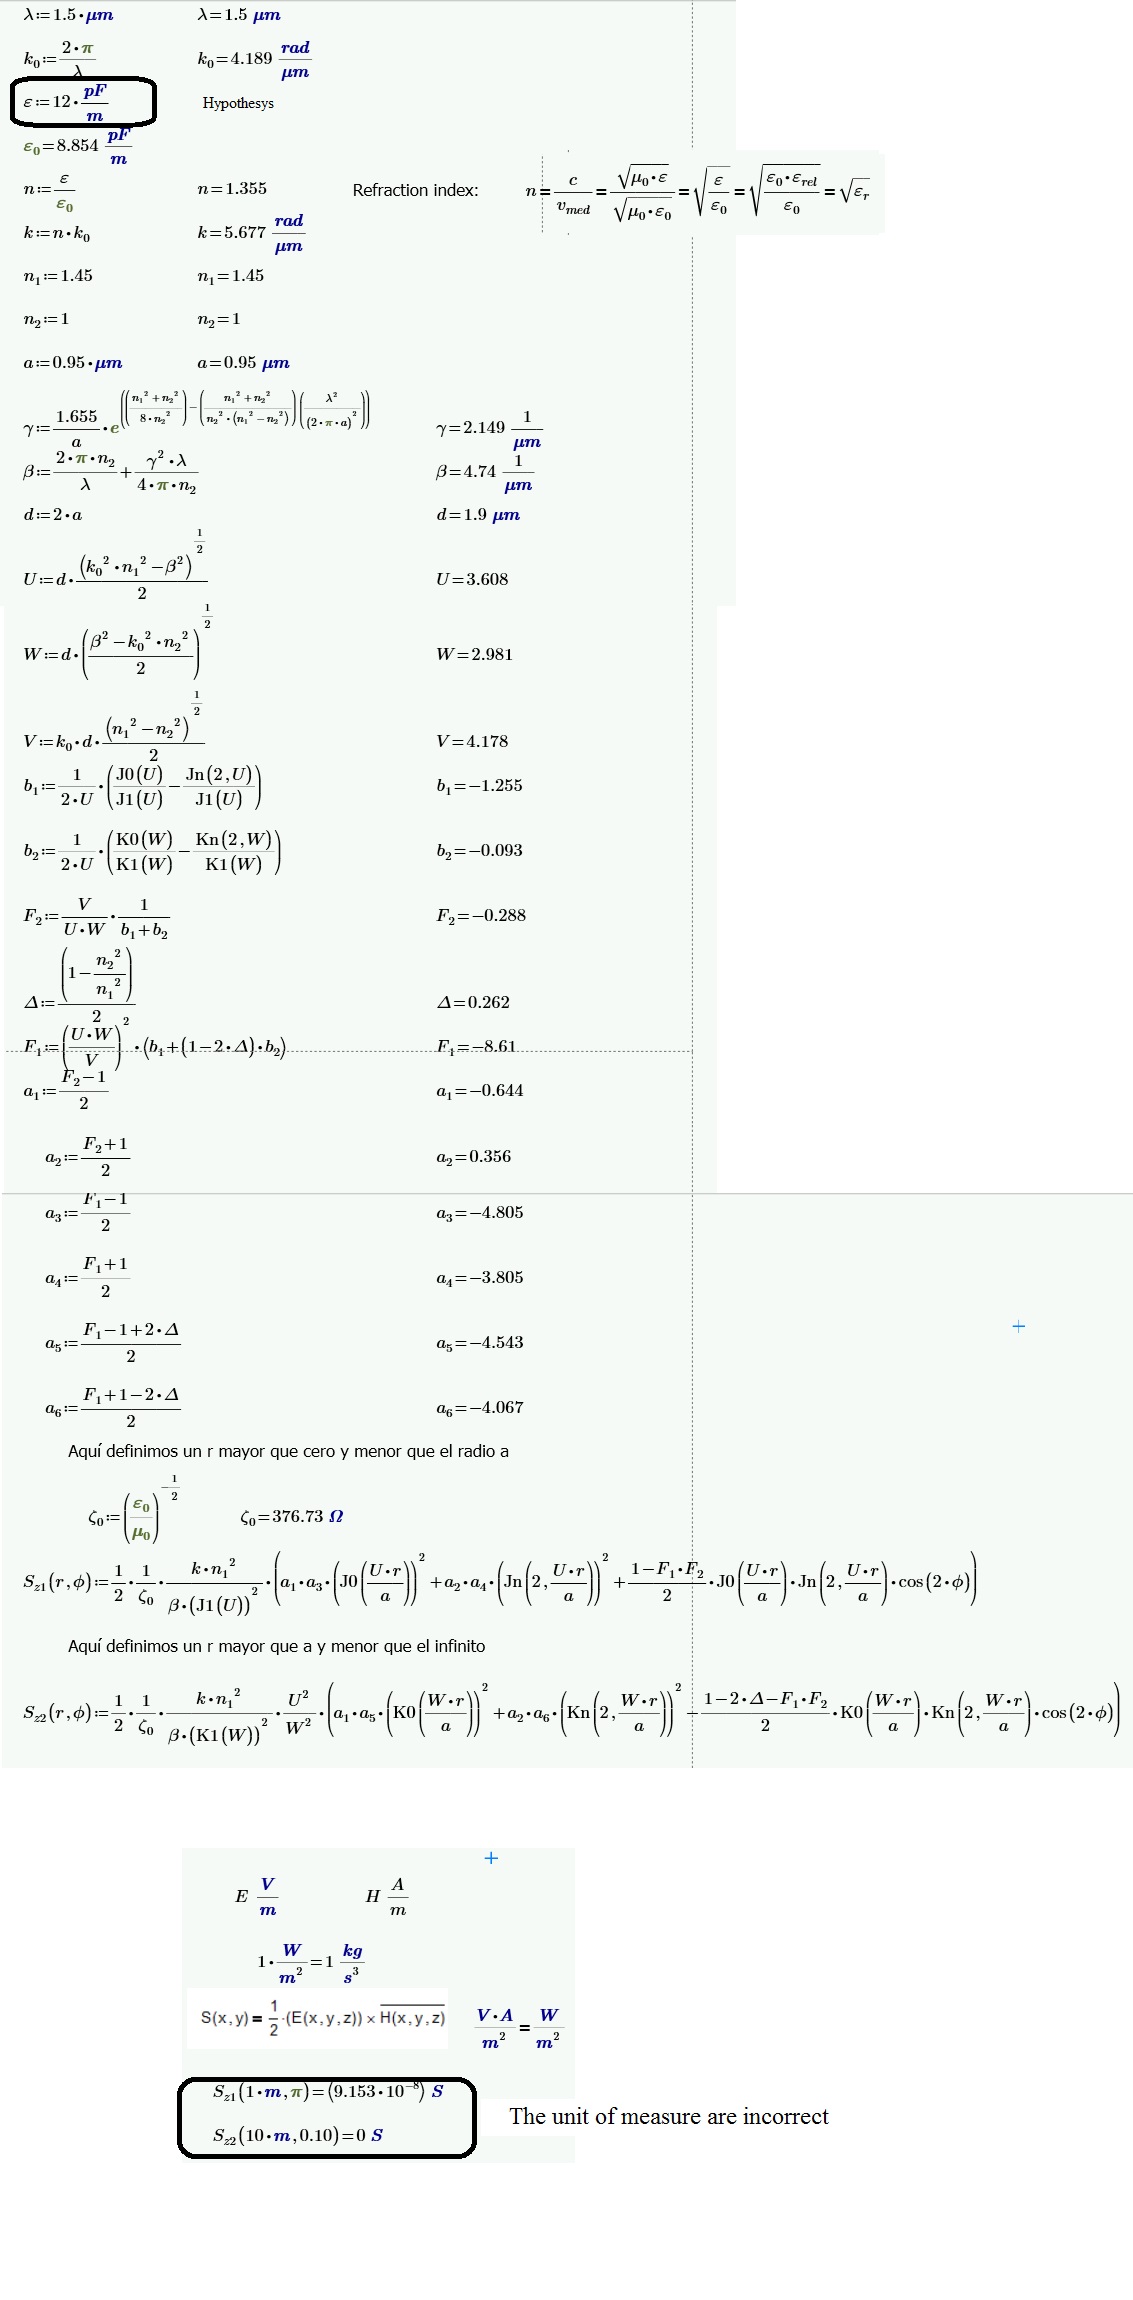
I have a problema with Sz1 (i need to use 0 < r < a)
and Sz2 (i need to use a <= r < infinite)
I need to graph both Sz1 and Sz2 in the same plot
I upload the file poynting.mcdx
thank you for your help
1 REPLY 1
Oct 10, 2016
05:20 AM
- Mark as New
- Bookmark
- Subscribe
- Mute
- Subscribe to RSS Feed
- Permalink
- Notify Moderator
Please log in to access translation
Oct 10, 2016
05:20 AM
You need to fix the units. The index n is confusing, should it be dimensionless? The measurement units of the Poynting vector are Watt on square meter. When the units are OK then you can try to plot graphs.
Here below there is my attempt to correct the units. But the units of the Poynting vectors are not correct.