- Subscribe to RSS Feed
- Mark Topic as New
- Mark Topic as Read
- Float this Topic for Current User
- Bookmark
- Subscribe
- Mute
- Printer Friendly Page
reading in 3-D array and fitting data to known functions using the linfitfunction
- Mark as New
- Bookmark
- Subscribe
- Mute
- Subscribe to RSS Feed
- Permalink
- Notify Moderator
reading in 3-D array and fitting data to known functions using the linfitfunction
Hi all
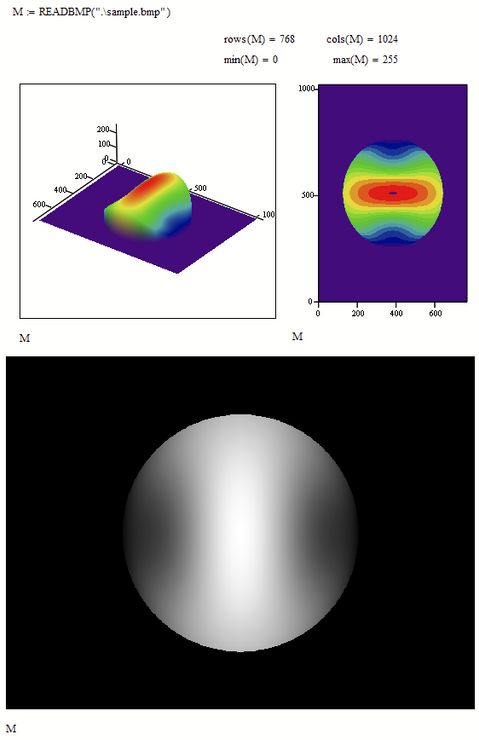
I have a bitmap image (see attached) that I would like to read into MathCad 15 and then fit this surface to a user defined set of polynomials using the linfit function. I have seen examples on the internet and this message board using an x-y data array and used them to fit data, but I wasn't able to find anything providing the syntax on how to load a 3-D array. Thanks and let me know if you have any questions.
- Labels:
-
Mathcad Usage
- Mark as New
- Bookmark
- Subscribe
- Mute
- Subscribe to RSS Feed
- Permalink
- Notify Moderator
Whats wrong with using READBMP to read-in the pic in a matrix?
Next time please post in the correct forum - for Mathcad usage thats https://community.ptc.com/t5/PTC-Mathcad-Questions/bd-p/PTCMathcad
I asked a mod to move this thread in the right place.
- Mark as New
- Bookmark
- Subscribe
- Mute
- Subscribe to RSS Feed
- Permalink
- Notify Moderator
Hi Werner
thanks for the reply. I should have been more clear in my question. I know how to read in the the bitmap image and, in fact, created the bitmap image using Mathcad. I have attached the script i put together to generate the image. my real question is in regards to the proper syntax and definition of the inputs for the Mathcad "linfit" function. all of the examples i have seen in the Mathcad help section and on this site involve fitting 2-D data. for my application, I have a circular,3-D surface that I would like to fit to a linear sum of polynomials. Based on the online help, the calling of the linfit function is straight forward and simply involves the data i want to fit and a vector of functions to be used for the fitting. The fitting vector definition is straight-forward as i know the basis set i want to use. I am just unclear on how to properly define the vectors of data values. in the attached work sheet, i have defined normalized rho and theta values to define the individual array coordinate positions, but how do i specify these for the input arguments to the linfit function? thanks for your consideration of my problem.
- Mark as New
- Bookmark
- Subscribe
- Mute
- Subscribe to RSS Feed
- Permalink
- Notify Moderator
All I see in your sheet is that you are creating the matrix of the pic of a white circular disc on black background in a quite complicated way (the matrix contains only 0 and 1 and is then multiplied by 255). No grayscale as seen on the pic you posted initially (probably because all k-values except one are zero).
And I see no attempt to define a couple of functions you would like to use for the fit and its not clear to me, what that fit function actually should fit. Should it be: Input the x- and y-coordinates in the picture, output: the (interpolated) greyscale value in the pic?
To the best of my knowledge the built-in "linfit" function will only do a 2D fit - x in, y out but not x and y in and z out.
So you will have to resort to create that on your own, I guess, presumably using a solve block with "minerr".
One additional remark:
Can of course be simplified if you can be sure that min(profile) will always be zero.


