
Turn on suggestions
Auto-suggest helps you quickly narrow down your search results by suggesting possible matches as you type.
Showing results for
Turn on suggestions
Auto-suggest helps you quickly narrow down your search results by suggesting possible matches as you type.
Showing results for
Community Tip - Need to share some code when posting a question or reply? Make sure to use the "Insert code sample" menu option. Learn more! X
Options
- Subscribe to RSS Feed
- Mark Topic as New
- Mark Topic as Read
- Float this Topic for Current User
- Bookmark
- Subscribe
- Mute
- Printer Friendly Page
resample function
Aug 06, 2009
03:00 AM
- Mark as New
- Bookmark
- Subscribe
- Mute
- Subscribe to RSS Feed
- Permalink
- Notify Moderator
Aug 06, 2009
03:00 AM
resample function
Hi.
Eden kindly gave me this fantastic function to resample a matrix at higher resolution. It is only now that I am using it and can't quite work out whats actually happening - although it does the job beautifully. Would any experts be kind enough to give me a quick explanation.
I can see it starts with taking the FFT and then checking for odd number of pixels in the image. But from there I am lost.
thanks
Jason
Labels:
- Labels:
-
Statistics_Analysis
83 REPLIES 83
Aug 08, 2009
03:00 AM
- Mark as New
- Bookmark
- Subscribe
- Mute
- Subscribe to RSS Feed
- Permalink
- Notify Moderator
Aug 08, 2009
03:00 AM
Thanks Lou!
Jason
Jason
Aug 10, 2009
03:00 AM
- Mark as New
- Bookmark
- Subscribe
- Mute
- Subscribe to RSS Feed
- Permalink
- Notify Moderator
Aug 10, 2009
03:00 AM
Am I correct to think that I need to pad integer numbers of data points with zeros into the frequency domain. so to obtain 4 x the resolution I would need to pad 4x the data points?
thanks
Jason
thanks
Jason
Aug 10, 2009
03:00 AM
- Mark as New
- Bookmark
- Subscribe
- Mute
- Subscribe to RSS Feed
- Permalink
- Notify Moderator
Aug 10, 2009
03:00 AM
You need to pad so the total is the desired number of points in each dimension (not logically nec. that these be the same, but the typical case for imaging). The padding is of course by an integer number of points, but the ratio of the new # pts. to the original # points does not need to be an integer. E.g., you may interpolate from 50 pts. to 183 pts by adding 133 pts. (zero value) in the appropriate freq. bins, per the description above. Add 150 pts. to get a total of 200, or 4x the original. (Do correctly for both dimensions in the 2D case. The 2D interp. fct. does this, and asks for the new # pts., not the # of added points.)
Does this answer your question?
Lou
Does this answer your question?
Lou
Aug 10, 2009
03:00 AM
- Mark as New
- Bookmark
- Subscribe
- Mute
- Subscribe to RSS Feed
- Permalink
- Notify Moderator
Aug 10, 2009
03:00 AM
Hi Lou.
Yes it does and very clearly. Once again thanks for showing me this technique and how to do it in Mathcad.
Jason
Yes it does and very clearly. Once again thanks for showing me this technique and how to do it in Mathcad.
Jason
Aug 12, 2009
03:00 AM
- Mark as New
- Bookmark
- Subscribe
- Mute
- Subscribe to RSS Feed
- Permalink
- Notify Moderator
Aug 12, 2009
03:00 AM
I also assume that the fucntional form i am using to fit the data (Virendra equations) assume rotational symmetry. The data may not be totally symmetric, so the resample method in this case would be more accurate, as I again assume it DOES allow for asymmetry.
Is there a fucntion or figur eof merit that can work out how symmetric a matrix is?
thanks
Jason
Is there a fucntion or figur eof merit that can work out how symmetric a matrix is?
thanks
Jason
Aug 12, 2009
03:00 AM
- Mark as New
- Bookmark
- Subscribe
- Mute
- Subscribe to RSS Feed
- Permalink
- Notify Moderator
Aug 12, 2009
03:00 AM
>Is there a function or figure of merit that can work out how symmetric a matrix is ? <<br> __________________________
Interesting question. A matrix is symmetric if she equals its transpose. The covariance of a symmetric matrix is a number ... anything to do with that ? Don't think so. Is there a measure of asymmetry between the two diagonals ? I have no recollection of such a question . And what about the Euclidean that we had explored in the past ?
jmG
Aug 12, 2009
03:00 AM
- Mark as New
- Bookmark
- Subscribe
- Mute
- Subscribe to RSS Feed
- Permalink
- Notify Moderator
Aug 12, 2009
03:00 AM
Hi Jean.
so a M-transpose(M) displayed as a graphic may show a visual representation.
I was thinking of comparing the 4 quadrants of a square matrix?
Jason
so a M-transpose(M) displayed as a graphic may show a visual representation.
I was thinking of comparing the 4 quadrants of a square matrix?
Jason
Aug 12, 2009
03:00 AM
- Mark as New
- Bookmark
- Subscribe
- Mute
- Subscribe to RSS Feed
- Permalink
- Notify Moderator
Aug 12, 2009
03:00 AM
On 8/12/2009 10:57:56 AM, Jbryant61 wrote:
>Hi Jean.
>
>so a M-transpose(M) displayed
>as a graphic may show a visual
>representation.
>
>I was thinking of comparing
>the 4 quadrants of a square
>matrix?
>
>Jason
____________________________
For such a question Jason, better ask Tom
Jean
>Hi Jean.
>
>so a M-transpose(M) displayed
>as a graphic may show a visual
>representation.
>
>I was thinking of comparing
>the 4 quadrants of a square
>matrix?
>
>Jason
____________________________
For such a question Jason, better ask Tom
Jean
Aug 12, 2009
03:00 AM
- Mark as New
- Bookmark
- Subscribe
- Mute
- Subscribe to RSS Feed
- Permalink
- Notify Moderator
Aug 12, 2009
03:00 AM
Just musing about how to look for a measure of circular symmetry (the matrix is a discrete Cartesian representation of the underlying structure). Call the fct. of interest f(r,a) in polar coordinates(r,a). One thought is to construct a new, circularly symmetric function g(r), with g(r) = mean [f(r,a)] over angle a. An asymmetry "error" h(r,a) can be defined = f(r,a) - g(r). The mean square of h over the plane can be compared to the mean square of f. Variations in amplitude weighting, radial weighting, etc. may be useful.
I don't know if there are any standard or known techniqques for this - haven't looked.
Lou
I don't know if there are any standard or known techniqques for this - haven't looked.
Lou
Aug 13, 2009
03:00 AM
- Mark as New
- Bookmark
- Subscribe
- Mute
- Subscribe to RSS Feed
- Permalink
- Notify Moderator
Aug 13, 2009
03:00 AM
>Just musing about how to look for a measure of circular symmetry...<<br> _______________________
Symmetric matrix isn't by any rule "circular". The RHMSD might be worth considering. For the two data sets considered: the fit and the real, the coordinates of the center of the searched � volume aren't centered, isn't sufficient to indicate a non-symmetric matrix ?
jmG
Symmetric matrix isn't by any rule "circular". The RHMSD might be worth considering. For the two data sets considered: the fit and the real, the coordinates of the center of the searched � volume aren't centered, isn't sufficient to indicate a non-symmetric matrix ?
jmG
Aug 13, 2009
03:00 AM
- Mark as New
- Bookmark
- Subscribe
- Mute
- Subscribe to RSS Feed
- Permalink
- Notify Moderator
Aug 13, 2009
03:00 AM
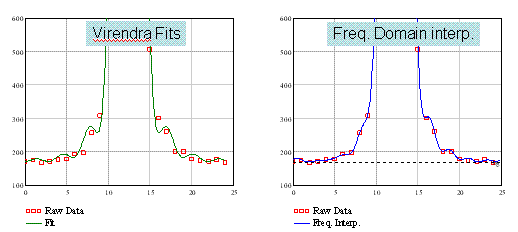
Hi Lou, following your comments below i have revisited comparing the two techniques and now believe that your method is the best. It appears to fit the background better. I think the fitting equation in the space domain assumes rotational symmetry, whereas your method doesn't.
>I can think of two structural
>sources of errors in addition
>to any numerical approximation
>errors:
I think the worksheet supports the conclusion your method is better. would you agree?
For the numerical approximation, if I increase the oversampling from 32 to 64 i see no effect. Does this suggest that 32 is adequate and the approaximation is very good?
>For the
>2D DFT method, the function
>was simply offset by its
>global minimum before
>integration(via scale fct.),
>leaving all contributions in
>the "dark" region to be
>positive.
>
Is there another way to define the background. The integrated value really depends on this, and I assume using the scale fucntion to define the background will just use the lowest value pixel.
thanks
Jason
Aug 13, 2009
03:00 AM
- Mark as New
- Bookmark
- Subscribe
- Mute
- Subscribe to RSS Feed
- Permalink
- Notify Moderator
Aug 13, 2009
03:00 AM
>I think the worksheet supports the conclusion your method is better <.
_________________________
You simply have two different projects. The fit has no interest as it can't apply to real images that will not be "spot", and the resample that suffers realism as not including the essential convolution as demonstrated previously. But for your answer, the fit part of the project has nothing to do in the work sheet as it couldn't apply to real images and is in excess as demonstrated in your previous "comparison of interpolation" that I have returned with the best fit circle applied on Lou resample. Whether resample is correct or not, it does circulate around the data set, you call it "rotational".
Jean
Aug 14, 2009
03:00 AM
- Mark as New
- Bookmark
- Subscribe
- Mute
- Subscribe to RSS Feed
- Permalink
- Notify Moderator
Aug 14, 2009
03:00 AM
Hi Jean, thanks for your comments.
> The fit has no
>interest as it can't apply to
>real images that will not be
>"spot",
I don't see it like that - maybe Im wrong.
By fitting to the expected fucntional form (Virendra) allows me to fill in the gaps of the pixellated data. For me, the key to having the functional form is two fold:
1: it allows me to integrate a continuous function
2: It also allows me to create whatever resolution I want, & so I can re-create the original resolution and directly compare with the original data.
In light of Lou's frequency domain interpolation I was surprised to see how the original Virendra fits were not properly fitting the data in the background (compared to Lou's method). At first I wanted to check Guy's Hankel transform approach to the integral (not that I doubt him, but it was a change I have implemented). Anyway after putting back the original functions it made no difference.
I am inclined to think that
a: The Virendra functions just don't allow any asymmetry - which there is a small amount
b: The functions don't allow for any kind of shot noise
c: The solver is homing in on a set of As & Ad that isn't necessarily the best
Thanks
Jason
Aug 14, 2009
03:00 AM
- Mark as New
- Bookmark
- Subscribe
- Mute
- Subscribe to RSS Feed
- Permalink
- Notify Moderator
Aug 14, 2009
03:00 AM
Obviously Jason, we aren't tuned ... most intersting his way.
I am inclined to think that
a: The Virendra functions just don't allow any asymmetry - which there is a small amount
b: The functions don't allow for any kind of shot noise
c: The solver is homing in on a set of As & Ad that isn't necessarily the best
==> Right Jason: Virendra is an asymmetric Gaussian fit
==> If the "spot" is a real symmetric (say circular) captured spot the � integral goes by the contour extract that I gave you and the best fit circle. If the captured spot is asymmetric (say elliptical) , same contour extract and best fit ellipse.
...............................
Hi Jean, thanks for your comments.
> The fit has no interest as it can't apply to real images that will not be "spot",<<br>
I don't see it like that - maybe I'm wrong.
By fitting to the expected functional form (Virendra) allows me to fill in the gaps of the pixellated data. For me, the key to having the functional form is two fold:
1: it allows me to integrate a continuous function
2: It also allows me to create whatever resolution I want, & so I can re-create the original resolution and directly compare with the original data.
==> Images aren't data of function(s), they are just data.
So, a spot is a spot but not a captured image generally. As long as you have interest in "spot' only, you will have to start all over again for images of the real life. At least you can see my points in the attached. The exercise I didn't do was : convolve resample2dD as in the attached demo, but you didn't show interest by not replying to the 3 methods compared and previously posted. Maybe other contributors wonder like me, if your camera will only "click' on dalmatians or "click" on more general life scenes ?
Whatever, all that "resample" is still on the design board.
Jean
Aug 14, 2009
03:00 AM
- Mark as New
- Bookmark
- Subscribe
- Mute
- Subscribe to RSS Feed
- Permalink
- Notify Moderator
Aug 14, 2009
03:00 AM
>==> Images aren't data of
>function(s), they are just
>data.
>So, a spot is a spot but not a
>captured image generally. As
>long as you have interest in
>"spot' only, you will have to
>start all over again for
>images of the real life. At
>least you can see my points in
>the attached. The exercise I
>didn't do was : convolve
>resample2dD as in the attached
>demo, but you didn't show
>interest by not replying to
>the 3 methods compared and
>previously posted. Maybe other
>contributors wonder like me,
>if your camera will only
>"click' on dalmatians or
>"click" on more general life
>scenes ?
>Whatever, all that "resample"
>is still on the design board.
>
>Jean
>
Hi Jean.
sorry I didn't reply, but to be honest I didn't understand you. (Remember I'm a rookie, and you are all the experts!)
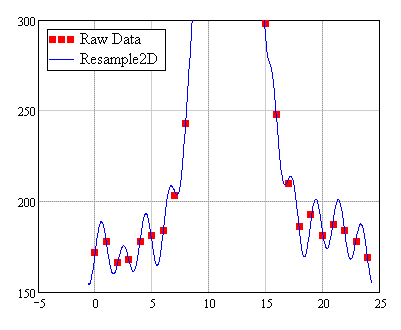
I still can't see why you feel the Resample doesn't work. The following image shows it fits the data much better than the Virendra fits.
>function(s), they are just
>data.
>So, a spot is a spot but not a
>captured image generally. As
>long as you have interest in
>"spot' only, you will have to
>start all over again for
>images of the real life. At
>least you can see my points in
>the attached. The exercise I
>didn't do was : convolve
>resample2dD as in the attached
>demo, but you didn't show
>interest by not replying to
>the 3 methods compared and
>previously posted. Maybe other
>contributors wonder like me,
>if your camera will only
>"click' on dalmatians or
>"click" on more general life
>scenes ?
>Whatever, all that "resample"
>is still on the design board.
>
>Jean
>
Hi Jean.
sorry I didn't reply, but to be honest I didn't understand you. (Remember I'm a rookie, and you are all the experts!)
I still can't see why you feel the Resample doesn't work. The following image shows it fits the data much better than the Virendra fits.
Aug 14, 2009
03:00 AM
- Mark as New
- Bookmark
- Subscribe
- Mute
- Subscribe to RSS Feed
- Permalink
- Notify Moderator
Aug 14, 2009
03:00 AM
Jean.
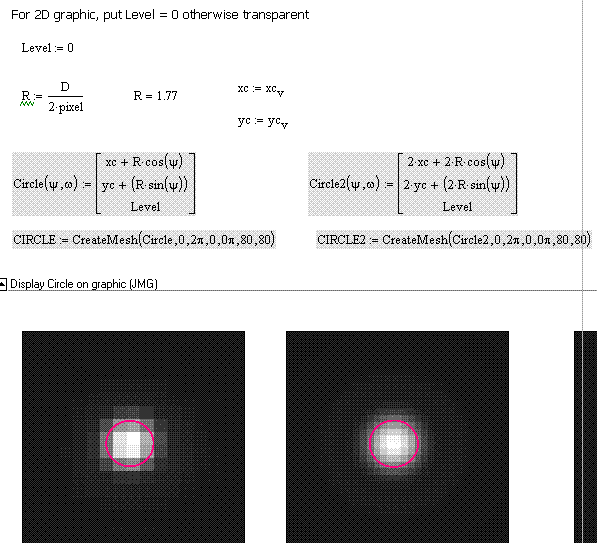
You have previously shown me how to superimpose a "circle" onto a graphic by using Createmesh.
could you show how to put a square on a graphic?
Thanks
Jason
You have previously shown me how to superimpose a "circle" onto a graphic by using Createmesh.
could you show how to put a square on a graphic?
Thanks
Jason
Aug 15, 2009
03:00 AM
- Mark as New
- Bookmark
- Subscribe
- Mute
- Subscribe to RSS Feed
- Permalink
- Notify Moderator
Aug 15, 2009
03:00 AM
On 8/14/2009 11:50:10 AM, Jbryant61 wrote:
>Jean.
>
>You have previously shown me
>how to superimpose a "circle"
>onto a graphic by using
>Createmesh.
>
>could you show how to put a
>square on a graphic?
>
>Thanks
>Jason
____________________________
On that typical Gaussian, we can locate a contour of a prescribed value and plot the square plane of the same size as the contour. For a square over a picture tool, I don't have it ready made.
Jean
Aug 15, 2009
03:00 AM
- Mark as New
- Bookmark
- Subscribe
- Mute
- Subscribe to RSS Feed
- Permalink
- Notify Moderator
Aug 15, 2009
03:00 AM
... back to resample,
That one does the same (better check !), lot more visible and auto-tutored, in shorter form. You may want to modify nc, nr to match "resample2D".
Jean
That one does the same (better check !), lot more visible and auto-tutored, in shorter form. You may want to modify nc, nr to match "resample2D".
Jean
Aug 16, 2009
03:00 AM
- Mark as New
- Bookmark
- Subscribe
- Mute
- Subscribe to RSS Feed
- Permalink
- Notify Moderator
Aug 16, 2009
03:00 AM
Jason,
The two work sheets of interest as they are at:
http://collab.mathsoft.com/~Mathcad2000/read?126998,11
... the spot (actually), pixelation of real image (future).
Jean
The two work sheets of interest as they are at:
http://collab.mathsoft.com/~Mathcad2000/read?126998,11
... the spot (actually), pixelation of real image (future).
Jean
Aug 17, 2009
03:00 AM
- Mark as New
- Bookmark
- Subscribe
- Mute
- Subscribe to RSS Feed
- Permalink
- Notify Moderator
Aug 17, 2009
03:00 AM
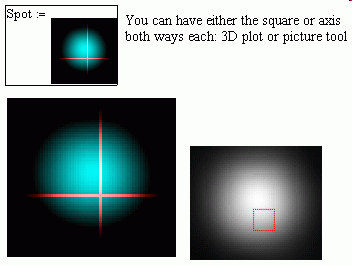
Sorry Jean. It was just the outline of a square I wanted to superimpose on a graphic. similar to the attached - but square.
thanks
Jason
thanks
Jason
Aug 17, 2009
03:00 AM
- Mark as New
- Bookmark
- Subscribe
- Mute
- Subscribe to RSS Feed
- Permalink
- Notify Moderator
Aug 17, 2009
03:00 AM
On 8/17/2009 4:03:56 AM, Jbryant61 wrote:
>Sorry Jean. It was just the
>outline of a square I wanted
>to superimpose on a graphic.
>similar to the attached - but
>square.
>
>thanks
>Jason
______________________________
Look at my last post "Pixelation", you can have either the square or the axis, both ways each: on the 3D patch plot or on the picture tool, as attached.
Jean
Aug 17, 2009
03:00 AM
- Mark as New
- Bookmark
- Subscribe
- Mute
- Subscribe to RSS Feed
- Permalink
- Notify Moderator
Aug 17, 2009
03:00 AM
On 8/17/2009 4:03:56 AM, Jbryant61 wrote:
>Sorry Jean. It was just the
>outline of a square I wanted
>to superimpose on a graphic.
>similar to the attached - but
>square.
>
>thanks
>Jason
______________________________
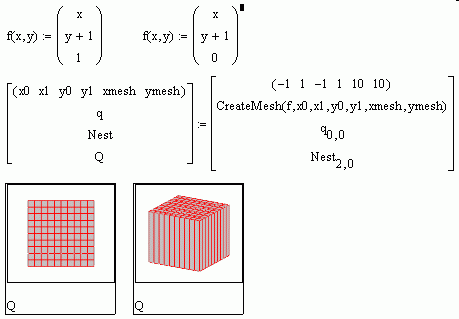
Yes, Jason
But a square does not come out of an f(x,y) function !
You must then go via a matrix construct, as done.
Jean
>Sorry Jean. It was just the
>outline of a square I wanted
>to superimpose on a graphic.
>similar to the attached - but
>square.
>
>thanks
>Jason
______________________________
Yes, Jason
But a square does not come out of an f(x,y) function !
You must then go via a matrix construct, as done.
Jean
Aug 13, 2009
03:00 AM
- Mark as New
- Bookmark
- Subscribe
- Mute
- Subscribe to RSS Feed
- Permalink
- Notify Moderator
Aug 13, 2009
03:00 AM
On 8/13/2009 6:47:57 AM, Jbryant61 wrote:
>Hi Lou, following your
>comments below i have
>revisited comparing the two
>techniques and now believe
>that your method is the best.
>It appears to fit the
>background better. I think the
>fitting equation in the space
>domain assumes rotational
>symmetry, whereas your method
>doesn't.
As far as the background, if the fitting fct. has an adjustable offset, then it should be possible to pick it so that the integral beyond some radius adds no significant contribution. I haven't looked at it.
>I think the worksheet supports
>the conclusion your method is
>better. would you agree?
>For the numerical
>approximation, if I increase
>the oversampling from 32 to 64
>i see no effect. Does this
>suggest that 32 is adequate
>and the approaximation is very
>good?
Given the low resolution of the original data, even this may be overkill, but it certainly appears to be sufficient. The inherent accuracy of either is not clear, but the analysis can be done to good precision (lots of digits, but not nec. meaningful).
>>For the
>>2D DFT method, the function
>>was simply offset by its
>>global minimum before
>>integration(via scale fct.),
>>leaving all contributions in
>>the "dark" region to be
>>positive.
>>
>Is there another way to define
>the background. The integrated
>value really depends on this,
>and I assume using the scale
>fucntion to define the
>background will just use the
>lowest value pixel.
True, but I tihnk the correct offset is that for which the integral beyond some radius adds no significant contribution, as mentioned above. If you beleive this should be the case, then there is a unique offset that gives this.
Lou
Aug 14, 2009
03:00 AM
- Mark as New
- Bookmark
- Subscribe
- Mute
- Subscribe to RSS Feed
- Permalink
- Notify Moderator
Aug 14, 2009
03:00 AM
Is this normal for there to be oscillations in the wings of the fit (from the Resample2D function), is there any way to dampen them?
thanks
Jason
thanks
Jason
Aug 17, 2009
03:00 AM
- Mark as New
- Bookmark
- Subscribe
- Mute
- Subscribe to RSS Feed
- Permalink
- Notify Moderator
Aug 17, 2009
03:00 AM
THis is most likely Gibbs ringing, which is an artifact of having a very sharp freq domain cutoff (created here by the insertion of all zero freq components next to the nonzero components of the upper end of the original half-spectrum). This is a mathematical artifact of a truncated Fourier series.
If this is a problem, then some other interpolation method should be used (bilinear, 2D spline, etc.). By def., anything that removes the ringing will also not preserve the exact freq. components as in the original spectrum, but this is not nec. a bad thing if elimination of the ringing is important.
Although the ringing shows in the image, it may not affect the integral. This is the explanation; your call as to whether it matters in the application.
Lou
Aug 17, 2009
03:00 AM
- Mark as New
- Bookmark
- Subscribe
- Mute
- Subscribe to RSS Feed
- Permalink
- Notify Moderator
Aug 17, 2009
03:00 AM
Thanks for your explanaition.
Im very impressed by this tecnique (as you have probably worked out!), especially where the fitting isn't as good in the background.
One thorn in the side though is that the resample isn't as good neat the centroid for some reason.
I'd also be keen to show Jean's "pad" function on here
Jason
Im very impressed by this tecnique (as you have probably worked out!), especially where the fitting isn't as good in the background.
One thorn in the side though is that the resample isn't as good neat the centroid for some reason.
I'd also be keen to show Jean's "pad" function on here
Jason
Aug 17, 2009
03:00 AM
- Mark as New
- Bookmark
- Subscribe
- Mute
- Subscribe to RSS Feed
- Permalink
- Notify Moderator
Aug 17, 2009
03:00 AM
I haven't been looking at the details, but there is something I don't understand about the whole concept of resampling. Why?
As I remember, the purpose was to calculate the convolution representing a pixel response. The procedure for resampling is to do a Fourier transform, insert additional frequence components with zero magnitude and then do the inverse Fourier transform. But the convolution is then done by doing a Fourier transform and multiplying by the transform of the pixel response. That seems to make the original inverse Fourier transform (the actual interpolation) redundant. The Fourier transform should just reproduce the original Fourier transfor with the inserted zeros. And since zeros don't contribute much to a product, it would seem that the whole calculation could just as well be done with the original Fourier transform, without the interpolation.
To Jason: You keep comparing the resampling to the Virenda fit. There is no valid comparison. Of course the resampling "fit" the background better -- it is an interpolation and simple reproduces the geven data. It is not any sort of fit. Like all interpolations, it makes no distiction whatsoever between signal and noise, cheerfully reproducing both. And, again like any interpolation, a good fit at the sampled points does not mean that it is at all reasonable between such points (see the section on ringing). As with your original calculations, you are being seduced by technical capabilities without proper regard as to the applicability and meaning for your situation.
__________________
� � � � Tom Gutman
Aug 17, 2009
03:00 AM
- Mark as New
- Bookmark
- Subscribe
- Mute
- Subscribe to RSS Feed
- Permalink
- Notify Moderator
Aug 17, 2009
03:00 AM
>And, again like any interpolation, a good fit at the sampled points does not mean that it is at all reasonable between such points ...<<br> ____________________
That's what I have demonstrated "ad absurdum" for several threads and as recently as last night. Resample2D does an apparent pixelation for the Gaussian spot only. I have applied on the 3 examples:
1. letter A
2. a square aperture (square spot)
3. a random image
Examples 1, 2 can't even be recognized ! The random is very bad. The conclusion of pixelation by oversampling is the Mathcad Improc zoom(,,,) and that's it. My Zoom(,,,) is integer and the Mathcad Improc is complete fractional. The source code couldn't be found. The exponential parenthood between the Gaussian spot and the Fourier do confuse the all thing. At least, all the optics gurus reading my replies are clear, the pixelation is the Mathcad Improc zoom ... end of the subject.
Thanks for trying to help.
For transportability and other aspects of the project design as an electronic gadget attached to a camera (scientific or popular), the zoom code is the missing link. The Java zoom I linked is damned interesting. What about the Java coding is another matter ! I really intend to purchase that tool, though it will be of personal use only, considering that most (if not all) web images are just *.jpg scrap or wavelet scrap and IE does not take some other *.jpg non standard.
You won't find all the material I have attached under "Pixelation" because the search tool does not work anymore and at all ! But eventually only two work sheets are conclusive, that I can repost if you intend to read.
jmG
Aug 18, 2009
03:00 AM
- Mark as New
- Bookmark
- Subscribe
- Mute
- Subscribe to RSS Feed
- Permalink
- Notify Moderator
Aug 18, 2009
03:00 AM
Tom, thanks for your comments.
On 8/17/2009 4:16:38 PM, Tom_Gutman wrote:
>I haven't been looking at the
>details, but there is
>something I don't understand
>about the whole concept of
>resampling. Why?
>
>As I remember, the purpose was
>to calculate the convolution
>representing a pixel response.
>The procedure for resampling
>is to do a Fourier transform,
>insert additional frequence
>components with zero magnitude
>and then do the inverse
>Fourier transform. But the
>convolution is then done by
>doing a Fourier transform and
>multiplying by the transform
>of the pixel response. That
>seems to make the original
>inverse Fourier transform (the
>actual interpolation)
>redundant. The Fourier
>transform should just
>reproduce the original Fourier
>transfor with the inserted
>zeros. And since zeros don't
>contribute much to a product,
>it would seem that the whole
>calculation could just as well
>be done with the original
>Fourier transform, without the
>interpolation.
Maybe Im not the best person to answer this (Lou, Richard, Guy, Phillip!), but I think the answer is that there are two things going on.
The convolution of the psf, pixel response and bead (i.e. a non-point object) through oversampling allowed me (or Lou!) to perform the FFT. This leads to a high res domain representation of a theoretical calculation for the diffraction limit that I would expect to observe on my camera with that bead. I could:
1: Stop here (in the high res domain) and compare my real CCD image after converting to the same high res domain, or
2: Compare everything in the CCD pixellation domain. For visual comparisons, as I actually see the CCD images, I like the comparison in this domain, but for the actual measurement on size, I revert back to the high res domain.
The resample function allows me to take my "blocky" CCD iamge and convert to the high res domain.
>To Jason: You keep comparing
>the resampling to the Virenda
>fit. There is no valid
>comparison. Of course the
>resampling "fit" the
>background better -- it is an
>interpolation and simple
>reproduces the geven data. It
>is not any sort of fit. Like
>all interpolations, it makes
>no distiction whatsoever
>between signal and noise,
>cheerfully reproducing both.
>And, again like any
>interpolation, a good fit at
>the sampled points does not
>mean that it is at all
>reasonable between such points
>(see the section on ringing).
The more I explore this whole topic, the more I learn. From the original Gaussian fits to the spots, through the Bessel functions and then lastly the Virendra equations have in my opinion been one step better than the previous. I was happy with this until....Lou/Richard showed me the concept of frequency padding. And of course there is Jean's Pad fucntion. I am not using the Virendra fits to obtain any quantity, but as it was the best fucntion that allowed energy transfer into the rings, it was a great equation to use for interpolating for a complete set of thru' focus images (which suffer a shape change), and then determine the minimum sized spot and call this "best focus". The Virendra equations are what you would expect the psf to be, but strictly speaking not the convolved data, so there is a slight error in using these and they do assume rotational symmetry. Lou's method did seem to be able to represent the blocky images better.
I would rather show graphics that can replicate the blocky pixels better than whats interpolated between them. I know I will never match exactly, but when I come across another method that appears to be better than my previous one, I want to pursue it. This is how I feel about resample2D. I know Jean says its no good for the letter "A", but I'm not examining these shapes, I am only interested in circular spots.
The down sampling is a seperate issue (again its only for visual presnetations). The improc zoom Jean told me about is interesting, but I believe it does some averaging and I don't know if this really represents the capture of a continuous signal onto a discrete CCD array. I didn't really undertsand Lou's argument here, I would have though it would be the integral as a given pixel will sum all light hitting that pixel.
The convolution of the psf, pixel and bead was an attempt to more accurately estimate how far from the diffraction limit my measurements are (rather than just using the psf). But the more I experience with this, there are just too many things I just can't know to be exactly sure what the D.L is (after convolution)- for example the fill factor on the camera, the lenslet design, what is the actual "emission" shape of my bead.
The resample and high res size measurements are an attemp for me to quantify the size of my currently measured objects (irrespective of how far they are from diffraction limit). I can then vary my optics and see if they get bigger or smaller.
As with your original
>calculations, you are being
>seduced by technical
>capabilities without proper
>regard as to the applicability
>and meaning for your
>situation.
>__________________
> Tom Gutman
I think you are wrong, Im actually being seduced by the whole of Mathcad, its capabilities and the friendliness and interest of this Forum.
I'm also well aware that I have a tendency to prolong topics, so as I don't want to outstay my welcome, please let me know if you want to finish the topic.
Jason
Aug 18, 2009
03:00 AM
- Mark as New
- Bookmark
- Subscribe
- Mute
- Subscribe to RSS Feed
- Permalink
- Notify Moderator
Aug 18, 2009
03:00 AM
The resampling is not what allows you to do an FFT. Indeed, it is gotten by doing an FFT to start. By construction the FFT of the resampled image is just the FFT of the original image with zeros inserted.
The relation between convolution and the pixel response is perhaps a bit subtle, but really rather straightforward. You are quite correct that the response of any specific pixel is just an integral of its response over the field of response (possibly taken as the whole picture, possibly simplified by taking a section of the picture as the support). But what is a convolution? It is defined as an integral. What Lou did was take the original problem, to find the response of the pixels in the camera, and generalize it to find the response for a pixel located at any position (not just the actual grid). That results in an integral of the sort known as a convolution. For any selected position it is evaluated as just an integral, the response integral for a pixel at that position.
Taken as a simple definition this generalization is not of much use, and is more complicated to use. But ..... there are tools for doing convolutions, tools that allow them to be calculated much faster than calculating all the individual integrals. That is what Lou did. Using the Fourier transform to calculate the the convolution, he effectively canlculates the pixel responses for a whole bunch of (hypothetical) pixels at one time. Much faster than doing the individual integrals. Then he can just select those positions that correspond to the actual pixels to get the actual pixel responses.
If you were not using the Virenda fits to extract parameters then you were seriously misusing the whole concept of fitting. You do not use fits to reconstruct the data -- yu have the actual data for that. You use fits to extract parameters that allow you to represent the signal part of the data, as distinct from the noise part.
One reason I largely dropped out of the original discussion is that you were blindly misapplying tools without properly validating them. You never really validated the Virenda equation as a suitable fit. The circle of half the total power is not a suitable measure of the size of the image. Because of their large size the rings can have appreciable power, but they do not contribute to the image size, which is controled by the central peak. You never validated the assumption that the beads were small enough to be considered as points for your analysis. You compared them to the wavelength of the light, but never compared them to the size of the spots you were trying to measure, nor, perhaps more importantly, to the accuracy that you were looking for.
__________________
� � � � Tom Gutman

