
Turn on suggestions
Auto-suggest helps you quickly narrow down your search results by suggesting possible matches as you type.
Showing results for
Please log in to access translation
Turn on suggestions
Auto-suggest helps you quickly narrow down your search results by suggesting possible matches as you type.
Showing results for
Community Tip - Stay updated on what is happening on the PTC Community by subscribing to PTC Community Announcements. X
Translate the entire conversation x
Please log in to access translation
Options
- Subscribe to RSS Feed
- Mark Topic as New
- Mark Topic as Read
- Float this Topic for Current User
- Bookmark
- Subscribe
- Mute
- Printer Friendly Page
template for FFT
Jan 21, 2013
10:51 AM
- Mark as New
- Bookmark
- Subscribe
- Mute
- Subscribe to RSS Feed
- Permalink
- Notify Moderator
Please log in to access translation
Jan 21, 2013
10:51 AM
template for FFT
Hello,
is there any template for a FFT plot in Mathcad Prime?
Let's say I have a CSV that contains noise data of an electronic component and I just want to plot voltage vs frequency. Where do I start? Any good tutorial for non-mathematicians? Most "introductions" aren't kept exactly simple.
Thanks
Labels:
- Labels:
-
Statistics_Analysis
18 REPLIES 18
Jan 21, 2013
11:48 AM
- Mark as New
- Bookmark
- Subscribe
- Mute
- Subscribe to RSS Feed
- Permalink
- Notify Moderator
Please log in to access translation
Jan 21, 2013
11:48 AM
In the "Help" files, search on "FFT".
There are several example worksheets that should be adequate.
Jan 21, 2013
11:55 AM
- Mark as New
- Bookmark
- Subscribe
- Mute
- Subscribe to RSS Feed
- Permalink
- Notify Moderator
Please log in to access translation
Jan 21, 2013
11:55 AM
Are there no templates available somewhere where I just could load the CSV into?
Of course I had a look at the help files.
Jan 21, 2013
12:13 PM
- Mark as New
- Bookmark
- Subscribe
- Mute
- Subscribe to RSS Feed
- Permalink
- Notify Moderator
Please log in to access translation
Jan 21, 2013
12:13 PM
It should not be that difficult to do it in Mathcad.
You should probably stick to using the FFT functions in Excel.
Jan 21, 2013
12:27 PM
- Mark as New
- Bookmark
- Subscribe
- Mute
- Subscribe to RSS Feed
- Permalink
- Notify Moderator
Please log in to access translation
Jan 21, 2013
12:27 PM
I would use excel, but my file CSV file is much bigger than excel can handle.
Jan 21, 2013
12:59 PM
- Mark as New
- Bookmark
- Subscribe
- Mute
- Subscribe to RSS Feed
- Permalink
- Notify Moderator
Please log in to access translation
Jan 21, 2013
12:59 PM
Steve Paul wrote:
I would use excel, but my file CSV file is much bigger than excel can handle.
Excel can handle up to a million rows. That should be enough for almost any application.
Maybe you could attach your CSV file to your post and some generous soul will have enough interest to help you.
Jan 21, 2013
01:15 PM
- Mark as New
- Bookmark
- Subscribe
- Mute
- Subscribe to RSS Feed
- Permalink
- Notify Moderator
Please log in to access translation
Jan 21, 2013
01:15 PM
My CSV has 36million lines and has a size of 1.3Gb.
I guess I have to walk through all the Mathcad help files. But as I said, they are not very easy to understand for someone who is new to Mathcad and is not very familiar with the Fourier Transform in general.
Jan 21, 2013
01:41 PM
- Mark as New
- Bookmark
- Subscribe
- Mute
- Subscribe to RSS Feed
- Permalink
- Notify Moderator
Please log in to access translation
Jan 21, 2013
01:41 PM
Where does the data come from?
Does the data have any periodicity?
Can you trim down the file into a manageable size?
Jan 21, 2013
02:32 PM
- Mark as New
- Bookmark
- Subscribe
- Mute
- Subscribe to RSS Feed
- Permalink
- Notify Moderator
Please log in to access translation
Jan 21, 2013
02:32 PM
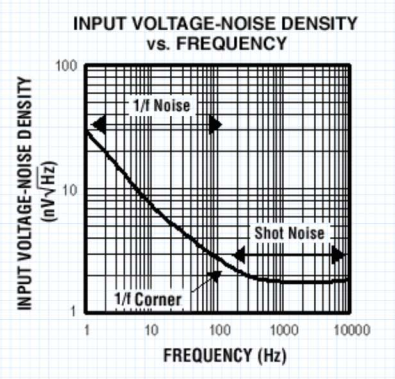
The data is electrical noise voltage from a magnetic sensor. The acquisition time is 10h and I cannot trim it down. I know Mathcad is capable of analyzing such a large amount of data.
Just don't know exactly where to start. All tutorials give examples of a simple waveform like a sinewave of a few datapoints to be analyzed. There is most likely no periodicity in this noise signal.
The test aims to determine the noise floor at different frequencies.
The final graph is supposed to look like this.
Jan 21, 2013
04:19 PM
- Mark as New
- Bookmark
- Subscribe
- Mute
- Subscribe to RSS Feed
- Permalink
- Notify Moderator
Please log in to access translation
Jan 21, 2013
04:19 PM
Hi Paul,
if it's just noise, then you can trim it down to any length. The only effect will be that the lower frequency that you can achieve in your noise vs frequency plot will come up.
For the 10h data you now have being 36 million lines, the lower frequency that the FFT will give is in the order of 30 uHz and your sampling frequency is probably 1 kHz. If you only want to go down to 1 Hz, you only need 1 or 2 seconds of data, that is 1000 or 2000 lines, anywhere from the huge file.
Assuming that your .CSV file has 1 sample per line, it should be no big problem to read it into an array. I don't know about Prime, but good old Mathcad version 11 had a limitation on array size in the order of a few million points, provided there's enough RAM in the machine.
Anyway, attached is a Mathcad v 11 file that reads a .CSV provided that each line holds one sample. I've included a Noise.CSV file.
Check it out in Prime.
Success!
Luc
Jan 21, 2013
05:09 PM
- Mark as New
- Bookmark
- Subscribe
- Mute
- Subscribe to RSS Feed
- Permalink
- Notify Moderator
Please log in to access translation
Jan 21, 2013
05:09 PM
Thank you for the file . How do I go from there?
I can work for now with a shrinked file. (in the end it will have to be the big one though)
Jan 21, 2013
05:58 PM
- Mark as New
- Bookmark
- Subscribe
- Mute
- Subscribe to RSS Feed
- Permalink
- Notify Moderator
Please log in to access translation
Jan 21, 2013
05:58 PM
You can chop up incredibly large files into managable chunks of reasonable size using the READFILE and WRITEFILE functions in Prime 2.0.
Jan 24, 2013
09:04 AM
- Mark as New
- Bookmark
- Subscribe
- Mute
- Subscribe to RSS Feed
- Permalink
- Notify Moderator
Please log in to access translation
Jan 24, 2013
09:04 AM
(in the end it will have to be the big one though)
Why? The extent of the data in the time domain determines the resolution in the frequency domain. As Luc has pointed out, 10 hours of data gives a frequency resolution of 10's of micro-Hertz. Do you really need that? If you want a 1Hz resolution, chop the data into 2048 point chunks, and transform, say, 1000 of them to get 1000 frequency domain spectra. Then average the absolute value of all those spectra to get the graph.
Jan 21, 2013
06:13 PM
- Mark as New
- Bookmark
- Subscribe
- Mute
- Subscribe to RSS Feed
- Permalink
- Notify Moderator
Please log in to access translation
Jan 21, 2013
06:13 PM
For the 10h data you now have being 36 million lines, the lower frequency that the FFT will give is in the order of 30 uHz and your sampling frequency is probably 1 kHz. If you only want to go down to 1 Hz, you only need 1 or 2 seconds of data, that is 1000 or 2000 lines, anywhere from the huge file.
This gives a Nyqist frequency of 500 Hz.
Looking at the OP's graph, it's not clear if an FFT will satisfy his needs.
Jan 21, 2013
05:35 PM
- Mark as New
- Bookmark
- Subscribe
- Mute
- Subscribe to RSS Feed
- Permalink
- Notify Moderator
Please log in to access translation
Jan 21, 2013
05:35 PM
You write that you are a "non-mathematician".
What is your degree in? What do you understand about FFTs?
Jan 21, 2013
05:48 PM
- Mark as New
- Bookmark
- Subscribe
- Mute
- Subscribe to RSS Feed
- Permalink
- Notify Moderator
Please log in to access translation
Jan 21, 2013
05:48 PM
Well , I know that it shows me the energy content at different frequencies. My experience with it is purely practical, like for example using a spectrum analyzer.
Jan 21, 2013
06:26 PM
- Mark as New
- Bookmark
- Subscribe
- Mute
- Subscribe to RSS Feed
- Permalink
- Notify Moderator
Please log in to access translation
Jan 21, 2013
06:26 PM
Well , I know that it shows me the energy content at different frequencies. My experience with it is purely practical, like for example using a spectrum analyzer.
An FFT can be tricky to analyze and interpret.
For example, if one were to take the FFT of a voltage waveform in volts, the magnitude of the FFT would be in volts/Hz. If the waveform was sinusoidal with a peak amplitude of 1 volt, only certain FFTs would show a peak of 1 volt in the frequency domain (depending on certain normalizing and other factors).
A spectrum analyzer measures the amount of power detected by a heterodyne receiver in a certain bandwidth around a particular frequency (power density), which can then be used to calculate the voltage across the input impedance (usually 50 ohms). Note that the definition of the bandwidth can change the answer in some cases.
You can construct an FFT worksheet that simulates a spectrum analyzer operating at a particular bandwidth, but you need to understand how each works and what the differences are.
Jan 24, 2013
02:30 PM
- Mark as New
- Bookmark
- Subscribe
- Mute
- Subscribe to RSS Feed
- Permalink
- Notify Moderator
Please log in to access translation
Jan 24, 2013
02:30 PM
Ok, I finally got the graph working.
How do I get a logarithmic scale on the X axis?
Here is a screen shot. The CSV is too big to post it here.
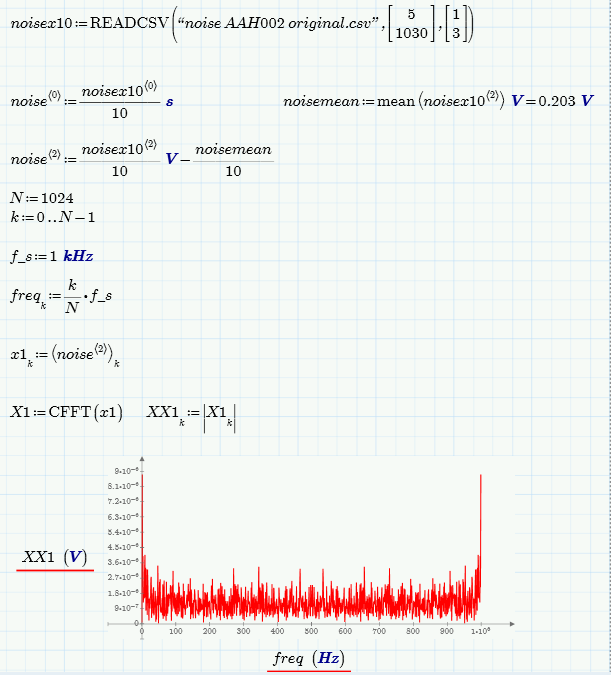
Thanks
Jan 24, 2013
02:47 PM
- Mark as New
- Bookmark
- Subscribe
- Mute
- Subscribe to RSS Feed
- Permalink
- Notify Moderator
Please log in to access translation
Jan 24, 2013
02:47 PM
Steve Paul wrote:
How do I get a logarithmic scale on the X axis?
Click on the x-axis to select it.
Go to the "Plot" tab. Click on the "Logarithmic Scaling" button.
Also, note that your graph is mirror symmetric about the 500 Hz point. This is an artifact of the FFT process. You should limit the graphed data to 500 Hz.


