Community Tip - You can subscribe to a forum, label or individual post and receive email notifications when someone posts a new topic or reply. Learn more! X
- Subscribe to RSS Feed
- Mark Topic as New
- Mark Topic as Read
- Float this Topic for Current User
- Bookmark
- Subscribe
- Mute
- Printer Friendly Page
Trajectory plotting in 3D
- Mark as New
- Bookmark
- Subscribe
- Mute
- Subscribe to RSS Feed
- Permalink
- Notify Moderator
Trajectory plotting in 3D
Hi,
I have a well trajectory and ellipses every x distance along the trajectory. The ellipses need to be azimuthally oriented (I have the corresponding azimuth data).
I can simplify the model and make the trajectory as vertical, then plot the elipses onto the trajectory.
What I'm really after is to plot the ellipses as a continous wellbore then assign a colour range to the OD of the wellbore (semi-major for example).
Can someone pls help ? ![]()
thank you
Mike
- Labels:
-
Statistics_Analysis
- Mark as New
- Bookmark
- Subscribe
- Mute
- Subscribe to RSS Feed
- Permalink
- Notify Moderator
I suggest you supply the data in a Mathcad worksheet, and perhaps a sketch of what you are expecting to see. Otherwise we may be wasting our time shooting in the dark!
Alan
- Mark as New
- Bookmark
- Subscribe
- Mute
- Subscribe to RSS Feed
- Permalink
- Notify Moderator
Something similar we previously helped solve...
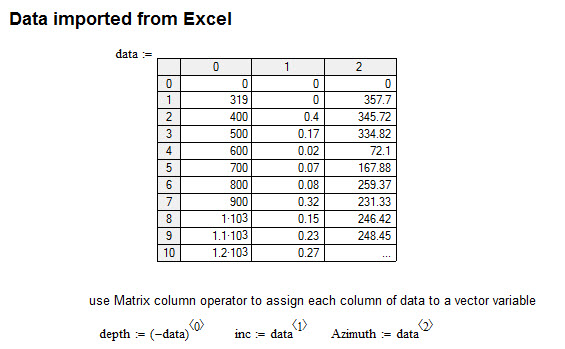
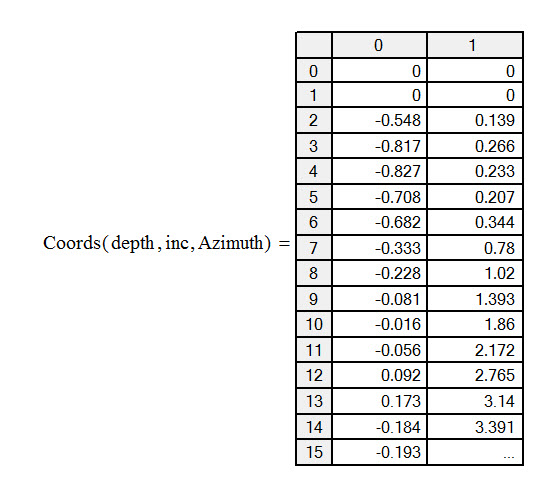
We wrote a short Mathcad program to create a function to convert an array (from Excel) of real world coordinates to Cartesian form
Mathcad 3D plot to help visualise the drill path
.
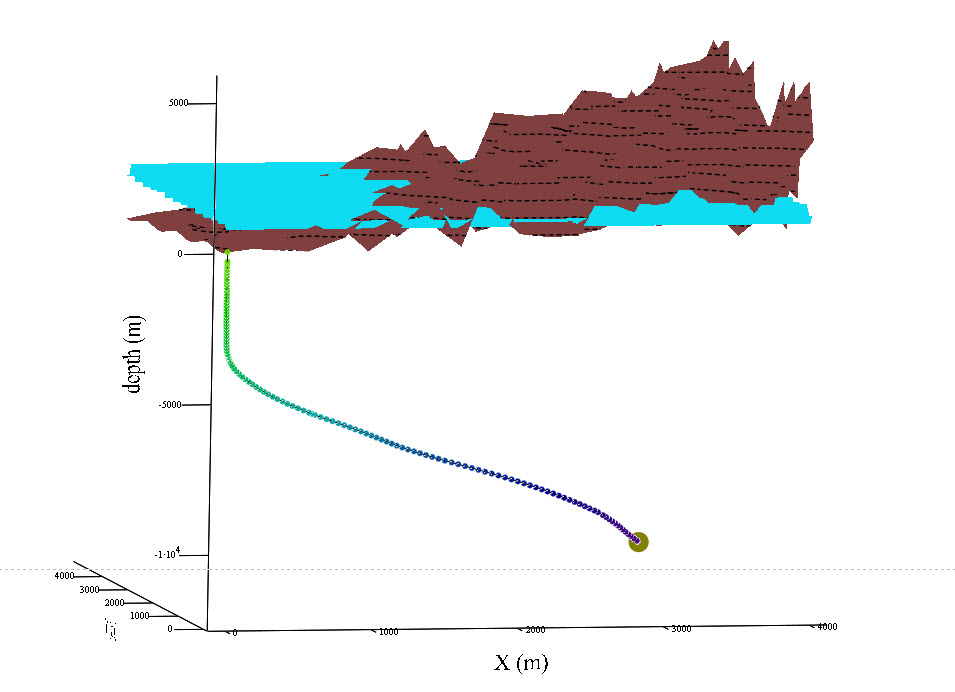
I assume you want to add ellipses along the drill path which are correctly oriented.
BR
Thomas
- Mark as New
- Bookmark
- Subscribe
- Mute
- Subscribe to RSS Feed
- Permalink
- Notify Moderator
Hi Thomas,
Any chance to see Mathcad worksheet from above?
- Mark as New
- Bookmark
- Subscribe
- Mute
- Subscribe to RSS Feed
- Permalink
- Notify Moderator
Sorry guys for not answering fast . . .
Yeh, I'm after something similar. But:
- the ellipses have direction (semi-major has azimuth set)
- I need to colour the range to see the wellbore OD (eg. change colour of semi major is greater than x inches )
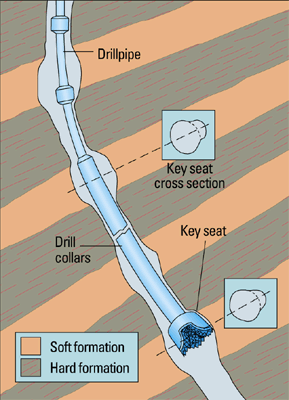
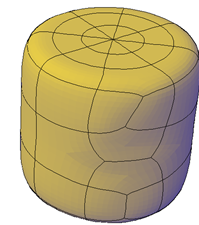
- and the worst one ![]() Is it possible to create a overall mesh or solid imag?instead of the ellipses? See the image attached (as a gross example)
Is it possible to create a overall mesh or solid imag?instead of the ellipses? See the image attached (as a gross example)
Pls let me know what you think.
I'm not sure how to plot the ellipse at 90 deg to the wellbore path and assing it a direction. Pls let me know, any similar examples etc . . .
Note, I can convert the ascii intpu to x,y,z coorinates as well. Also i have a handfull of data, more than 20K of ellipses to plot ![]()
Depth(m) is the same for Wellbore and caliper (they're matched by depth).
wellbore Az = direction of well.
Inc = wellbore inclination
CaliperXY OD of the wellbore, orthogonal to each other.
Az_caliper1 = direction of the caliper arm (same origin as wellbore, grid).
| Wellbore Az(deg dec) | Depth(m) | Inc (deg dec) | Caliper1(in) | Caliper2 (in) | Az_Caliper1(deg dec) |
| 225.2 | 10 | 0 | 3.0287 | 3.116 | 15.5 |
| 225.2 | 10.1 | 0.11 | 3.03 | 3.09 | 15.45 |
| 225.2 | 10.2 | 0.1 | 3.05 | 3.11 | 15.3 |
| 225 | 10.30 | 0.15 | 3.12 | 3.10 | 15.22 |
| 224.8 | 10.40 | 0.2 | 3.13 | 3.10 | 15.12 |
| 224.6 | 10.50 | 0.244 | 3.16 | 3.09 | 15.02 |
- Mark as New
- Bookmark
- Subscribe
- Mute
- Subscribe to RSS Feed
- Permalink
- Notify Moderator
Without actually calculating the required data arrays to recreate the shape features you require, this was my best effort with Mathcad...
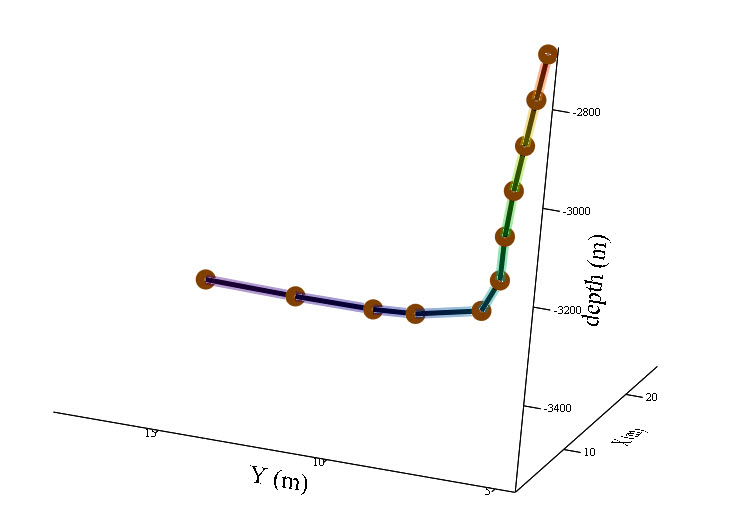
My thoughts are that, whilst adding the detail (ellipses) along the drill path should be possible in a 3D plot.
It may be easier/more appropriate to use tools better fit for simplifying such tasks.
In this case, because Mathcad arrays can be directly imported into PTC Creo Parametric.
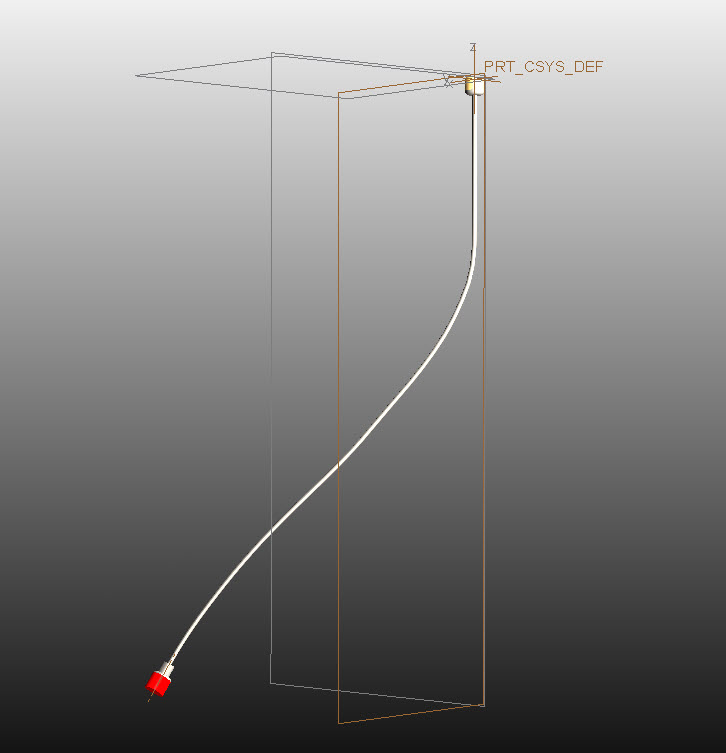
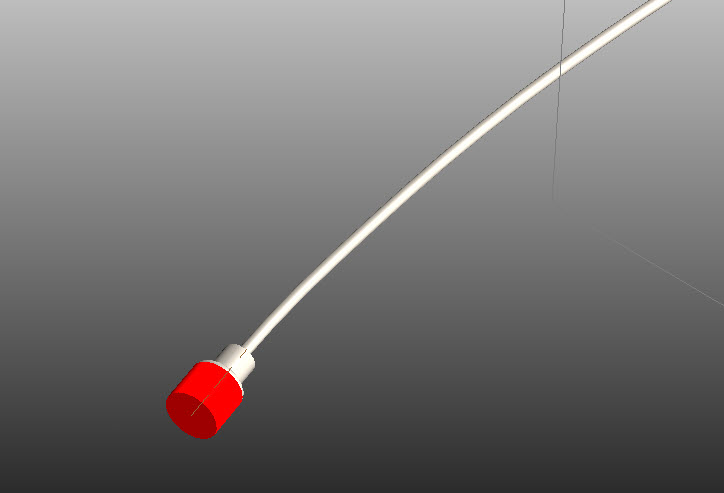
In the example above the data (x,y,z) array from Mathcad is used to define a curve in Creo parametric and reconstruct the drill path.
It simple to then build specific geometry along the curve that represents the drill path.
With the data linked to model, it should be possible to quickly update the view with new drill data.
Here is the attached Mathcad file.
This can be done with both Mathcad 15 or Prime 2.0 and Creo Parametric 2.0.
For reference there is a great Mathcad e-book written by Professor Byrge Birkeland on creating all sorts of shapes and surface in Mathcad plots.
Its here if your interested.
BR
Thomas


