
Turn on suggestions
Auto-suggest helps you quickly narrow down your search results by suggesting possible matches as you type.
Showing results for
Turn on suggestions
Auto-suggest helps you quickly narrow down your search results by suggesting possible matches as you type.
Showing results for
Community Tip - When posting, your subject should be specific and summarize your question. Here are some additional tips on asking a great question. X
Options
- Subscribe to RSS Feed
- Mark Topic as New
- Mark Topic as Read
- Float this Topic for Current User
- Bookmark
- Subscribe
- Mute
- Printer Friendly Page
Almost there but could use some help for a possible double vector setup
Nov 12, 2013
12:01 PM
- Mark as New
- Bookmark
- Subscribe
- Mute
- Subscribe to RSS Feed
- Permalink
- Notify Moderator
Nov 12, 2013
12:01 PM
Almost there but could use some help for a possible double vector setup
Hi,
the last time i posted really has helped with getting my mathcad file setup the way i want. Im 95 % finished this calculation but not sure how to add what im needing.
- If you open the mathcad file and scroll down past " END OF CALCULATION 1 " you will come accross a list box.
- In this list box you can choose between 5 values of RMV
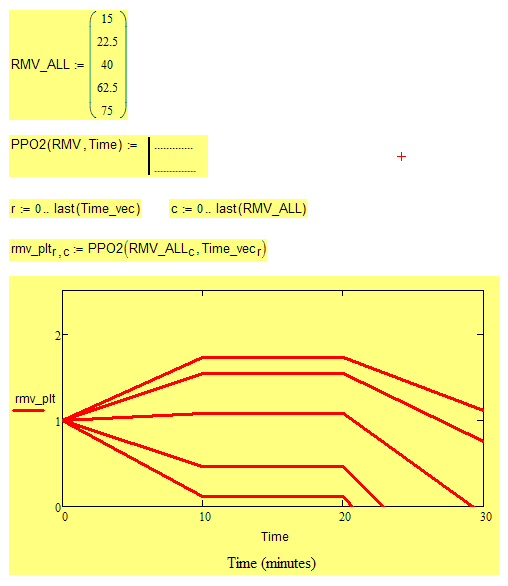
- after choosing a value a graph will be plotted at the bottom of the page. See PPO2 graph. However i want to plot this graph for all values of RMV
- For demonstration purposes of what i want i have manually inputted the RMV values onto a seperate graph
If anyone can help me i will be forever greatfull
best regards
Simon
5 REPLIES 5
Nov 12, 2013
12:29 PM
- Mark as New
- Bookmark
- Subscribe
- Mute
- Subscribe to RSS Feed
- Permalink
- Notify Moderator
Nov 12, 2013
12:29 PM
Turn rmv?? into a function dependend on RMV and call it vectorized. So you should get a 5-element vector consisting of the vectors rmv?? you want to plot.
Nov 12, 2013
01:22 PM
- Mark as New
- Bookmark
- Subscribe
- Mute
- Subscribe to RSS Feed
- Permalink
- Notify Moderator
Nov 12, 2013
01:22 PM
I reread what you wrote and I think I understand better now what you want.
Nevertheless it still applies that you should turn your calculation into functions.
At last you need a function for the calculation of PPO2 which is not only dependend on a (scalar) Time but also on a (scalar) RMV.
Don't think you will have success with vectorization to get the datastructure you need for plottingf. You can either use a small program using loops or use range variables as shown below. The plot is of course a fake as I didn't bother to wade through all those variables and turning them into functions 😉
Nov 13, 2013
05:38 AM
- Mark as New
- Bookmark
- Subscribe
- Mute
- Subscribe to RSS Feed
- Permalink
- Notify Moderator
Nov 13, 2013
05:38 AM
Im suprised how hard this is to do with mathcad, you would think i could use a set of code with different input variables slightly easier
I will try what you have mentioned however doubt wether i will manage as im not an experienced mathcad user
thanks
Nov 13, 2013
06:49 AM
- Mark as New
- Bookmark
- Subscribe
- Mute
- Subscribe to RSS Feed
- Permalink
- Notify Moderator
Nov 13, 2013
06:49 AM
You are doing simple calculations (with a lot of variables, though) for one RMV.
If you like to do it for ten different RMV values you can
1) run the sheet ten times with different input and print the results
2) copy the calculations ten times (please don't do that)
3) turn the calculations into a function (better plan it that way from the beginning) and you can call it with as many values you like.
Turning your sheet into a function may be difficult as you are reusing the same variable names and sometimes even for different things while on the other hand you assign variables just different names. This makes the calculations hard to follow for others.
If a result of a calculation is dependent on one or more inputs its usually a good idea to implement it as a function rather than just change th input value on top of the sheet and let it recalculate. Doing it the latter way you can only have one result at the time. If you need the results for different input values at the same time (as you demand for the plot) you need a function you can call with different values.
Nov 13, 2013
06:56 AM
- Mark as New
- Bookmark
- Subscribe
- Mute
- Subscribe to RSS Feed
- Permalink
- Notify Moderator
Nov 13, 2013
06:56 AM
yeh cheers ! ill hopefully get stuck into mathcad training at some point so i can layout my sheets more methodically ... for now im just going to print the sheet with different values of RMV

