
Turn on suggestions
Auto-suggest helps you quickly narrow down your search results by suggesting possible matches as you type.
Showing results for
Please log in to access translation
Turn on suggestions
Auto-suggest helps you quickly narrow down your search results by suggesting possible matches as you type.
Showing results for
Community Tip - If community subscription notifications are filling up your inbox you can set up a daily digest and get all your notifications in a single email. X
Translate the entire conversation x
Please log in to access translation
Options
- Subscribe to RSS Feed
- Mark Topic as New
- Mark Topic as Read
- Float this Topic for Current User
- Bookmark
- Subscribe
- Mute
- Printer Friendly Page
Basic Plot with Units - Problem
Nov 11, 2016
05:34 AM
- Mark as New
- Bookmark
- Subscribe
- Mute
- Subscribe to RSS Feed
- Permalink
- Notify Moderator
Please log in to access translation
Nov 11, 2016
05:34 AM
Basic Plot with Units - Problem
Dear Friends,
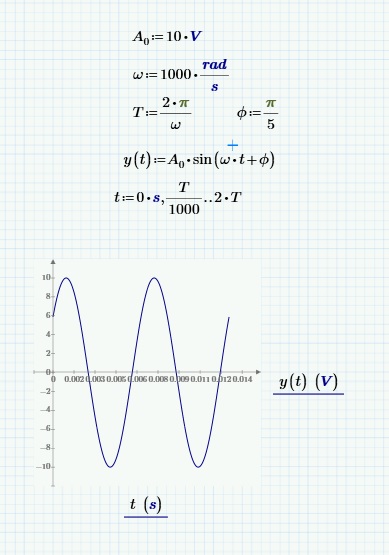
I'm quite new in Mathcad. I have basic question: I'd like to plot a graph of sin() function. I'd like to have argument of time in seconds and return values in Volts. If I insert for X-axis (which is variable t) unit s, Mathcad automatically makes this axis unitless [(1/s) *s]. What am I doing wrong? I know that I cen generate vector o time samples t:=0s,1s..10s but I don't understand why can't I simply change units from unitless to seconds?
I attached picture.
Thank You very much in advance for help.
Best regards,
Wojciech

Labels:
- Labels:
-
Other
4 REPLIES 4
Nov 11, 2016
07:01 AM
- Mark as New
- Bookmark
- Subscribe
- Mute
- Subscribe to RSS Feed
- Permalink
- Notify Moderator
Please log in to access translation
Nov 11, 2016
07:01 AM

Nov 11, 2016
08:42 AM
- Mark as New
- Bookmark
- Subscribe
- Mute
- Subscribe to RSS Feed
- Permalink
- Notify Moderator
Please log in to access translation
Nov 11, 2016
08:42 AM
You never specified that t had unit time. Mathcad will let you plot a function of an unspecified parameter, it assigns values from -10 to 10. There's a clue:
 Mathcad will force units to balance; so when you typed the s in the units placeholder, Mathcad divided it by the time default unit.
Valery defined a range variable with units: 
to get his plot to work with units.
Nov 11, 2016
08:42 AM
- Mark as New
- Bookmark
- Subscribe
- Mute
- Subscribe to RSS Feed
- Permalink
- Notify Moderator
Please log in to access translation
Nov 11, 2016
08:42 AM
Nov 11, 2016
11:22 AM
- Mark as New
- Bookmark
- Subscribe
- Mute
- Subscribe to RSS Feed
- Permalink
- Notify Moderator
Please log in to access translation
Nov 11, 2016
11:22 AM
Thank you very much Valery Ochkov, Fred Kohlhepp and F.M. for your answers! Now it is clear for me that in order to work with the units I have to first define range variable, which at the same time, defines units for x-axis (in my case).
Best regards,
Wojciech


