cancel
Showing results for 
Search instead for 
Did you mean: 
cancel
Showing results for 
Search instead for 
Did you mean: 

Community Tip - Want the oppurtunity to discuss enhancements to PTC products? Join a working group! X

Basic Plot with Units - Problem

wslowik
1-Newbie

Basic Plot with Units - Problem

Dear Friends,

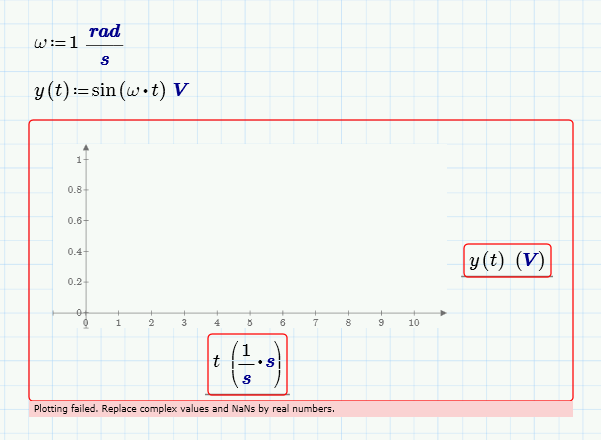
I'm quite new in Mathcad. I have basic question: I'd like to plot a graph of sin() function. I'd like to have argument of time in seconds and return values in Volts. If I insert for X-axis (which is variable t) unit s, Mathcad automatically makes this axis unitless [(1/s) *s]. What am I doing wrong? I know that I cen generate vector o time samples t:=0s,1s..10s but I don't understand why can't I simply change units from unitless to seconds?

I attached picture.

Thank You very much in advance for help.

Best regards,

Wojciech

Plot_with_Units.PNG

4 REPLIES 4

You never specified that t had unit time.  Mathcad will let you plot a function of an unspecified parameter, it assigns values from -10 to 10.  There's a clue:

Mathcad will force units to balance; so when you typed the s in the units placeholder, Mathcad divided it by the time default unit.

Valery defined a range variable with units:

to get his plot to work with units.

-MFra-
21-Topaz II
(To:wslowik)

sinus.jpg

Thank you very much Valery Ochkov, Fred Kohlhepp and F.M. for your answers! Now it is clear for me that in order to work with the units I have to first define range variable, which at the same time, defines units for x-axis (in my case).

Best regards,

Wojciech

Top Tags