
Turn on suggestions
Auto-suggest helps you quickly narrow down your search results by suggesting possible matches as you type.
Showing results for
Please log in to access translation
Turn on suggestions
Auto-suggest helps you quickly narrow down your search results by suggesting possible matches as you type.
Showing results for
Community Tip - Learn all about PTC Community Badges. Engage with PTC and see how many you can earn! X
Translate the entire conversation x
Please log in to access translation
Options
- Subscribe to RSS Feed
- Mark Topic as New
- Mark Topic as Read
- Float this Topic for Current User
- Bookmark
- Subscribe
- Mute
- Printer Friendly Page
Curve fitting as a combination of straight line segments
Oct 16, 2019
07:09 AM
- Mark as New
- Bookmark
- Subscribe
- Mute
- Subscribe to RSS Feed
- Permalink
- Notify Moderator
Please log in to access translation
Oct 16, 2019
07:09 AM
Curve fitting as a combination of straight line segments
Hello
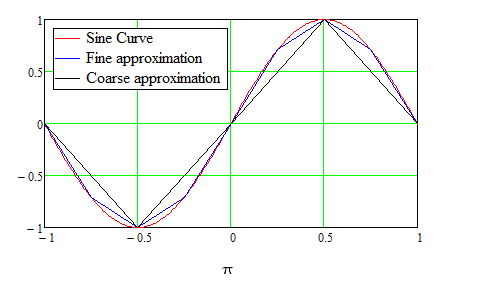
I would like to convert a given set of data to a segment of straight lines, rather than a perfect curve. For example, in the attached picture, I would like to convert the data for the sine curve into a set of straight line. Two examples are illustrated in the attachment. One is an approximation connecting the peaks and zeros and the other is more refined approximation. If I use the regression (least square method) on the sine curve, I get a horizontal line.
Question: how to convert the given sine curve data into a set of lines and make them more refined, i.e., with the help of some refining variable.
Labels:
15 REPLIES 15
Oct 16, 2019
07:45 AM
- Mark as New
- Bookmark
- Subscribe
- Mute
- Subscribe to RSS Feed
- Permalink
- Notify Moderator
Please log in to access translation
Oct 16, 2019
07:45 AM
If you have the data as matched pairs X and Y, the command is
fn(x) := linterp(X,Y,x)
Oct 16, 2019
08:44 AM
- Mark as New
- Bookmark
- Subscribe
- Mute
- Subscribe to RSS Feed
- Permalink
- Notify Moderator
Please log in to access translation
Oct 16, 2019
08:44 AM
I'd do it like this. change spacing variable to control the fit.

Oct 16, 2019
08:52 AM
- Mark as New
- Bookmark
- Subscribe
- Mute
- Subscribe to RSS Feed
- Permalink
- Notify Moderator
Please log in to access translation
Oct 16, 2019
08:52 AM
Or for some more sophisticated approaches see this thread
https://community.ptc.com/t5/PTC-Mathcad/Calculating-slope-in-dataset/td-p/498334/page/2
Oct 30, 2019
03:46 AM
- Mark as New
- Bookmark
- Subscribe
- Mute
- Subscribe to RSS Feed
- Permalink
- Notify Moderator
Please log in to access translation
Oct 30, 2019
03:46 AM
Thanks for the thread. Yes, that is what I was looking for.
Oct 16, 2019
10:12 AM
- Mark as New
- Bookmark
- Subscribe
- Mute
- Subscribe to RSS Feed
- Permalink
- Notify Moderator
Please log in to access translation
Oct 16, 2019
10:12 AM
What exactly do you need?
Do you just want the graph to be more or less 'refined', like this:

Or do you want the line properties for each of the line segments that make up your curve approximation, like this:

Above is an example with 4 line segments. With 6 line segements you get:

Success!
Luc
Oct 29, 2019
06:47 AM
- Mark as New
- Bookmark
- Subscribe
- Mute
- Subscribe to RSS Feed
- Permalink
- Notify Moderator
Please log in to access translation
Oct 29, 2019
06:47 AM
Thanks. I am looking for regression analysis for a given data in form of a set of lines with properties of each segment. The sine curve was just an example. Here the 'sine' curve should be treated as unknown. I have tried to explain it better in the attached worksheet. Please see attached.
Oct 29, 2019
08:09 AM
- Mark as New
- Bookmark
- Subscribe
- Mute
- Subscribe to RSS Feed
- Permalink
- Notify Moderator
Please log in to access translation
Oct 29, 2019
08:09 AM
The challenge with fitting a set of straight lines to a non-linear data set lies in determining where the "break points" are. If you can divide the data into groups that define each line segment (command would be "submatrix"), then either "line," or "intercept," and "slope" will give you the least squares linear fit. But automating the choice of where to split up the data set will be challenging.
Oct 29, 2019
10:54 PM
- Mark as New
- Bookmark
- Subscribe
- Mute
- Subscribe to RSS Feed
- Permalink
- Notify Moderator
Please log in to access translation
Oct 29, 2019
10:54 PM
Here is your data, with four line fits (done in EXCEL). But where you set the ends of the fits makes a huge difference.

Oct 30, 2019
03:52 AM
- Mark as New
- Bookmark
- Subscribe
- Mute
- Subscribe to RSS Feed
- Permalink
- Notify Moderator
Please log in to access translation
Oct 30, 2019
03:52 AM
thanks. this might work. but I was looking for a solution in Mathcad.
Oct 30, 2019
03:15 AM
- Mark as New
- Bookmark
- Subscribe
- Mute
- Subscribe to RSS Feed
- Permalink
- Notify Moderator
Please log in to access translation
Oct 30, 2019
03:15 AM
Thanks. Yes, that is the challenge. Attached is the mathematical process. I was looking for a function that can do it.
This is useful in simplification of creating a target response spectrum for seismic testing or design basis where 4 or 5 points cover the entire data which is mean of a much larger set of data.
Oct 30, 2019
09:43 AM
- Mark as New
- Bookmark
- Subscribe
- Mute
- Subscribe to RSS Feed
- Permalink
- Notify Moderator
Please log in to access translation
Oct 30, 2019
09:43 AM
I looked at your pdf paper, that should be able to be made to work; but I got lost in the notation changes. If this author wrote a FORTRAN program then Mathcad can certainly handle this problem. The only issue would be how many line segments to use--the author compares 2, 3, and 4 lines in his paper. Clearly the best linear line fit would be to connect the dots (linterp), but it will be difficult to automate a different criteria.
Oct 31, 2019
07:02 AM
- Mark as New
- Bookmark
- Subscribe
- Mute
- Subscribe to RSS Feed
- Permalink
- Notify Moderator
Please log in to access translation
Oct 31, 2019
07:02 AM
thanks.
Oct 29, 2019
09:01 AM
- Mark as New
- Bookmark
- Subscribe
- Mute
- Subscribe to RSS Feed
- Permalink
- Notify Moderator
Please log in to access translation
Oct 29, 2019
09:01 AM
Note sure what you intend to do with the regression lines you are looking for.
Maybe simple linear interpolation is all you need?

Oct 30, 2019
03:20 AM
- Mark as New
- Bookmark
- Subscribe
- Mute
- Subscribe to RSS Feed
- Permalink
- Notify Moderator
Please log in to access translation
Oct 30, 2019
03:20 AM
thanks. linterp will not give me a set of four or five straight lines. I have to provide a simple chart that is used as the design basis based on the data which is the mean curve of a large set of curves (response spectra of earthquake records). Building codes provide few points which define the seismic design basis for a site. I am trying to do something similar. see my reply to the other post where I have attached the literatur to achieve it.
Oct 29, 2019
09:13 AM
- Mark as New
- Bookmark
- Subscribe
- Mute
- Subscribe to RSS Feed
- Permalink
- Notify Moderator
Please log in to access translation
Oct 29, 2019
09:13 AM
Hi,
the simplest way possible:


