Community Tip - Learn all about PTC Community Badges. Engage with PTC and see how many you can earn! X
- Subscribe to RSS Feed
- Mark Topic as New
- Mark Topic as Read
- Float this Topic for Current User
- Bookmark
- Subscribe
- Mute
- Printer Friendly Page
How to make a bode plot from a transfer function
- Mark as New
- Bookmark
- Subscribe
- Mute
- Subscribe to RSS Feed
- Permalink
- Notify Moderator
How to make a bode plot from a transfer function
Hello guys,
please help me to solve this problem.
I would like to plot the magnitude and phase over a logarithmic frequency axis for a given transfer function.
In the first picture I create the transfer function with symbolic mathematics.
In the second picture I declare some parameters (but without units !) and I tried to plot the magnitude ...
The single point in the graph is unclear to me with a value of approx. 20 ?? All the values on the y-axis must be < 1 ... or < 0db
Thanks in advance
- Labels:
-
Electrical_Engineering
- Mark as New
- Bookmark
- Subscribe
- Mute
- Subscribe to RSS Feed
- Permalink
- Notify Moderator
Please attach your Prime worksheet, not just a picture!
It will help us to help you in the best way.
Success!
Luc
- Mark as New
- Bookmark
- Subscribe
- Mute
- Subscribe to RSS Feed
- Permalink
- Notify Moderator
Hello guys,
I did not upload my sheet because I know there are compability problems with different mathcad-versions. I am using mathcad prime 3.0
Anyway, I attached my sheet, I hope it helps!
Unfortunately it didnt work ... , but good idea with the variable i - in my case k -
Since s = 2*pi*k* I also dont like the steps with 2*pi = approx. 6Hz ...
How would you scale the steps of the x-axis to 1Hz, 2Hz, 3Hz, ...
Or even better: How do I scale the x-axis logarithmically? In that case the steps would be 1Hz, 10Hz, 100Hz, 1kHz, ...
Thanks in advance and best regards,
Dimitri
- Mark as New
- Bookmark
- Subscribe
- Mute
- Subscribe to RSS Feed
- Permalink
- Notify Moderator
The attached pdf was created in Prime 4.0 Express. Since you're using 3.0, the Mathcad file won't do much, but you can type the expressions--they should run in 3.0. (The grid plot is a special, not part of what PTC sells, but you can have a logarithmic scale from the plot menu.
- Mark as New
- Bookmark
- Subscribe
- Mute
- Subscribe to RSS Feed
- Permalink
- Notify Moderator
Hello Fred,
thank you for the good explanation. It is interesting how to obtain the grid. I cant see the formula of it in the pdf...
Can you share me more infos regarding the logarithmic grid?
Anyway, it works 🙂 Great!
Can you also please explain the equation for the steps (marked in red)?
How do you obtain the phase over frequency in mathcad?
Best regards
Dimitri
- Mark as New
- Bookmark
- Subscribe
- Mute
- Subscribe to RSS Feed
- Permalink
- Notify Moderator
Grid is actually a series of functions that either Luc Meekes or Werner built; there are a number of posts on this site.
The last three are one function, I've tried to show over laps.
The red equation makes the vector s a logarithmic progression so it plots; it could be linear, but a huge number of points would crowd right on the plot
Luc's "logspace" does the same thing and is neater; some of us "old dogs" can't learn new tricks.
- Mark as New
- Bookmark
- Subscribe
- Mute
- Subscribe to RSS Feed
- Permalink
- Notify Moderator
You can use the function logspace, which creates an array with log-spaced elements.
To use that array inthe plot, you have to vectorize the function (That's what the arrow above 20*log... is about). And of course, being a math application, the imaginary constant (i or j, whichever you like) is predefined.
The attached file is Prime 3.0
Success!
Luc
- Mark as New
- Bookmark
- Subscribe
- Mute
- Subscribe to RSS Feed
- Permalink
- Notify Moderator
The same exercise in Mathcad 11:
- Mark as New
- Bookmark
- Subscribe
- Mute
- Subscribe to RSS Feed
- Permalink
- Notify Moderator
Dear luc,
thank you very much for your help so far, but please have a look in the file attached.
I marked my questions in red.
There is fundamentally something wrong ... I dont understand
- Mark as New
- Bookmark
- Subscribe
- Mute
- Subscribe to RSS Feed
- Permalink
- Notify Moderator
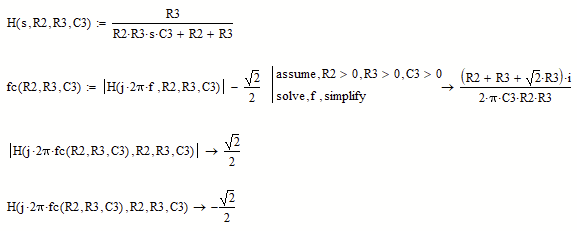
The reason you get a different answer is because I use a (completely) different mathcad (11), with a completely different symbolic engine (Maple). But apart from that, the frequency should not come out as a complex number.
Did you check the result: does the symbolic result of |R3/(R2+...fpole(R2,R3,C3)...*R3)| result in SQRT(2)/2 ?
What happens in your solve, f if you omit the absolute value on the expression to the left of the =, and square both sides so you get: (R3/(...))^2=1/2 solve,f>
Note that e^(pi * 1i) is a sophisticated way to describe -1.
Success!
Luc
- Mark as New
- Bookmark
- Subscribe
- Mute
- Subscribe to RSS Feed
- Permalink
- Notify Moderator
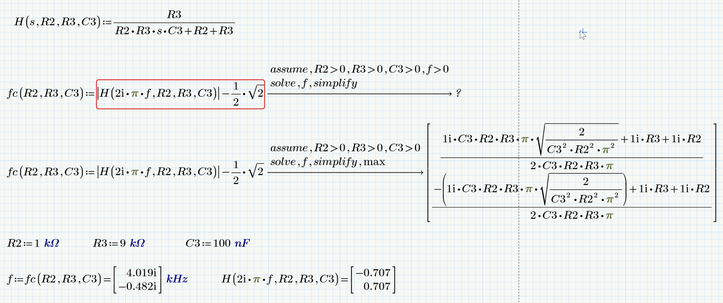
The main problem is that Maple (the symbolic engine in Luc's MC11) prefers and assume real numbers, unless otherwise stated, but MuPad (the default symbolic engine in Prime up to version 5) default to complex numbers.
The result which Mupad delivers is as correct as useless.
You could use the assume modifier to tell MuPad that some/All variables are real (>0 automatically implies real as well), but unfortunately Mathcad (and also Prime) will run "endless" if I add "f>0" to the assume modifier and then eventually crashes - I would call this a bug.
One workaround is a twofold symbolic evaluation:
This is the result you need, even though it doesn't loolk like because of the imaginary unit after the root. But note that this imaginary unit just means to change all signs inside of the root. Somehow MuPad seems to prefer complex/imaginary results over real ones.
I used Mathcad 15 but I guess the same workaround will work OK in Prime, too.
- Mark as New
- Bookmark
- Subscribe
- Mute
- Subscribe to RSS Feed
- Permalink
- Notify Moderator
BTW, the new symbolic engine in Prime 6 is even worse.
It does not crash when I add "f>0" but it simply asserts that it can't find a solution.
Otherwise it also delivers an imaginary frequency (even two of them) which makes H(...) a real number (+- sqrt 2/2). In contrast to MuPad, however, it is not even able to simplify the expression in a reasonable way:
The workaround described above works OK in Prime with the old symbolic (muPad)
but not with the new one
probably because the magnitude is not simplified to a square root.
- Mark as New
- Bookmark
- Subscribe
- Mute
- Subscribe to RSS Feed
- Permalink
- Notify Moderator
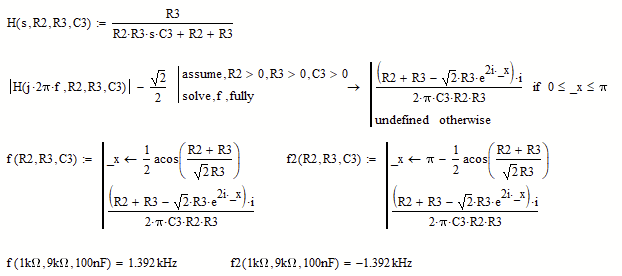
One last remark:
MuPad is correct (but not helpful) - any value of _x gives a correct solution, but usually the frequency is non-real. Only for a certain value of _x (which you can see in the picture) we get a real positive solution:
- Mark as New
- Bookmark
- Subscribe
- Mute
- Subscribe to RSS Feed
- Permalink
- Notify Moderator
Look for the differences:


