Community Tip - Learn all about PTC Community Badges. Engage with PTC and see how many you can earn! X
- Community
- Systems/Software Engineering
- Systems/Software Engineering
- Re: Requirements traceability Status in Integrity
- Subscribe to RSS Feed
- Mark Topic as New
- Mark Topic as Read
- Float this Topic for Current User
- Bookmark
- Subscribe
- Mute
- Printer Friendly Page
Requirements traceability Status in Integrity
- Mark as New
- Bookmark
- Subscribe
- Mute
- Subscribe to RSS Feed
- Permalink
- Notify Moderator
Requirements traceability Status in Integrity
I am using Integrity for my Requirments and Test Management for various projects

I am expert in DOORs for 14yrs and this isb my first time hands on Integiry since 10months, able to trace requirements to various documents per our process, but at a one glance i am not able to produce the Tracability Metrics to check how many requirement id's are broke or not connected
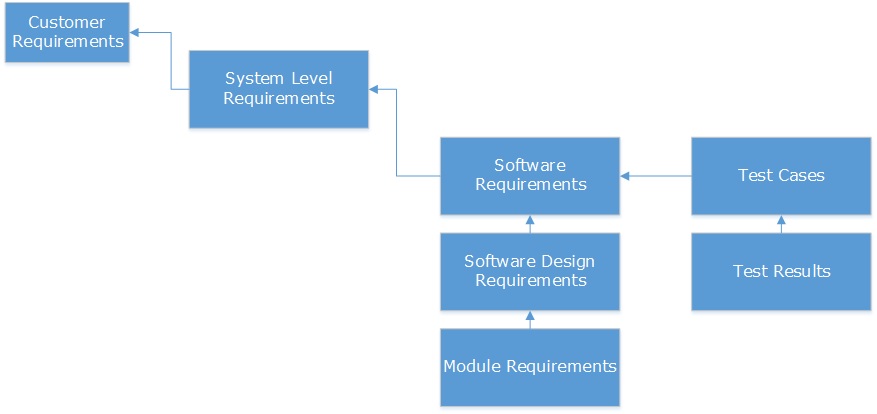
Say for an example, i got following traceability process across various documents,
Here i need a queres that can be written and assigned to a repoort generator which can provide the statics of How many Customer req's are connected to how mnay System level req's
How many Customer requirments are having no trace's, like wise i need a table of metrics and when i click those number it should take to those set of requirements
I tried my best but i am not able to get professional level queir and report generations, i asked couple time if such basis reoports can be provided by PTC itself along with product
Any help on this topci will be greatly appreciated
- Labels:
-
Requirements Connector
- Mark as New
- Bookmark
- Subscribe
- Mute
- Subscribe to RSS Feed
- Permalink
- Notify Moderator
Hi Balaji,
Depending on your implementation you may or may not have a field on the Customer Requirement node called Trace Status or Downstream Trace Count which are computed fields or triggered fields that change when a trace is added or removed. If you do have these fields then its a simple matter of running a query of all customer requirements with a Trace Status of none or a downstream trace count of 0. Of course downstream trace count will show any downstream trace so perhaps not just to system requirements again depending on your implementation. Once you have your query you can use it in reports or charts as needed.
If you do not have these fields then you need to create a query that filters on "relationships", "name of relationship", "has relationship" and then invert it and add a second filter for your specific type.
So for a full example, I have a query that looks at all requirement nodes (type = requirement) and filter relationships -> Validated By -> Has NO validated by relationships which will give me every requirement node in the system i have permission to see that does not have a trace to a test case.
- Mark as New
- Bookmark
- Subscribe
- Mute
- Subscribe to RSS Feed
- Permalink
- Notify Moderator
Hi Balaji,
You can create Traceability Matrix for the same requirement you have...
Please check my screenshot and let me know do you want this ??
I think this is exact you want ???
Waiting for your quick response ??
Regards,
Kapil
- Mark as New
- Bookmark
- Subscribe
- Mute
- Subscribe to RSS Feed
- Permalink
- Notify Moderator
Hi Kapil,
Could you please let me know the procedure to generate such a traceability matrix shown below.
Regards,
Anirudh
- Mark as New
- Bookmark
- Subscribe
- Mute
- Subscribe to RSS Feed
- Permalink
- Notify Moderator
Hi Kapil,
Could I have the Traceability Matrix, I have the same need
Thanks
John
- Mark as New
- Bookmark
- Subscribe
- Mute
- Subscribe to RSS Feed
- Permalink
- Notify Moderator
Hi @jhm,
That matrix report is OOTB provided by PTC but may i know about your exact requirement like in between which document type you want this kind of report etc. ? Because after looking to your exact requirement we can think of creating our own report with recipes created by me that includes more features as compare to OOTB Reports.
Regards,
Kapil
- Mark as New
- Bookmark
- Subscribe
- Mute
- Subscribe to RSS Feed
- Permalink
- Notify Moderator
Hi Kapil,
Thanks for getting back to me.
We have tried the OOTB report engine, and it does not do what we require.
I can send you some files that will help explain it better.
John
- Mark as New
- Bookmark
- Subscribe
- Mute
- Subscribe to RSS Feed
- Permalink
- Notify Moderator
Hi Kapil,
This is what I am looking for, I tried using reportengine
Full Traceability report using report recipes – John
From customer document all the way to test cases
Excel report would be best format
Readability / usability is key
- Mark as New
- Bookmark
- Subscribe
- Mute
- Subscribe to RSS Feed
- Permalink
- Notify Moderator
Hi Kapil,
Just checking with you...
John
- Mark as New
- Bookmark
- Subscribe
- Mute
- Subscribe to RSS Feed
- Permalink
- Notify Moderator
Hi @jhm,
You can send DM to me containing your exact requirement and more details.
Email :- kapil.jain@lnttechservices.com
Regards,
Kapil
- Mark as New
- Bookmark
- Subscribe
- Mute
- Subscribe to RSS Feed
- Permalink
- Notify Moderator
Hi,
can you please show me an example of how the numbers you are looking for are displayed in the tool you worked with before?
And, where you want to display these numbers?
At the project item itself from Integrity, in a query?
If in a query, please provide to me an example of how does this look like.
Volker
- Mark as New
- Bookmark
- Subscribe
- Mute
- Subscribe to RSS Feed
- Permalink
- Notify Moderator
Hi Volker,
I am looking to generate charts in PTC as shown in the attachment.
Say, I have 100 requirements in a document, I want to create a chart which displays below details in a single chart
1. Requirements which has relationship "decomposed from" (say 50)
2. Requirements which has relationship "decomposes To" (say 20)
3. Requirements which don't have both relation ships "Decomposed From" and "Decomposes To" (Say 30)
At the moment I could able to generate these charts with the help of Traces (downstream, upstream etc.),
But the constraint with this attribute is, for downstream trace, it also consider "Validated By" relationship in addition to "Decomposes To"
I need to generate charts which has traceability information only between requirements and another chart displaying traceability information(i.e., count) between requirements -- "Validatedby" -- "Validates".
Could you please let me know if this is possible in PTC.
Regards,
Anirudh
- Mark as New
- Bookmark
- Subscribe
- Mute
- Subscribe to RSS Feed
- Permalink
- Notify Moderator
Hi Anirudh,
yes, of course this is also possible.
The trace counts are fields with formulas (calculations), and you can for sure define an additional field with a calculation, and count only "decomposes to", but leave "validated by" out.
This would require that you talk to your admin, because only an Integrity admin can define and link such fields.
Such a field should be a static field only, means updated once a day only (night job).
The key question for me is in regards to the starting point: do you like to see the metric on document level (for each individual document, or on project level - for all docs in the project). The later will allow you that you can put the chart also into a dashboard - dashboards allow you to filter by project.
Finally, according to your request, I assume you rather want a "has a trace", instead of "trace counter", is this correct?
Hope that is helpful.
Volker
- Mark as New
- Bookmark
- Subscribe
- Mute
- Subscribe to RSS Feed
- Permalink
- Notify Moderator
Hi Volker,
Thanks for your feedback.
Yes, I would like to see these metrics on document level.
Sorry, I am not an expert in this topic, can you please elaborate, "has a trace" and "trace counter" to answer your question.
As you said, "define an additional field with calculation and count only 'decomposes to', but leave 'validated by' field".
Here, do you mean to write these formulas in "Aggregation" or "Grouping" tab while defining a chart, do I need to define a query and map it to a chart?
At the moment, I am generating chart by "Grouping" trace status as shown in the image.
Regards,
Anirudh.
- Mark as New
- Bookmark
- Subscribe
- Mute
- Subscribe to RSS Feed
- Permalink
- Notify Moderator
Hi Anirudh,
I am not aware of an option to run charts on doc level, without some kind of customization.
Some time ago I created a "Chart Starter" to perform exactly this task.
You can define any type of chart that you like to run an item level, and then you would choose the menu "Custom > Chart Starter" to get a list of possible charts, and finally the output.
The "Chart Starter" was a Java App, in todays world I would perhaps use an HTML report with build in JavaScript and a Charting Library.
Still you need to calculate the individual values once, in the chart itself, and/or in additional fields.
Hope this helps and clarifies.
Send me a PM when you are interested in the Chart Starter.
Volker
- Mark as New
- Bookmark
- Subscribe
- Mute
- Subscribe to RSS Feed
- Permalink
- Notify Moderator
Hi Volker
This is John, I would be interested in the Chart Starter, if it is still available
Thanks
John


