- Community
- ThingWorx
- ThingWorx Developers
- Re: CPU usage 100% for Thingworx Postgresql
- Subscribe to RSS Feed
- Mark Topic as New
- Mark Topic as Read
- Float this Topic for Current User
- Bookmark
- Subscribe
- Mute
- Printer Friendly Page
CPU usage 100% for Thingworx Postgresql
- Mark as New
- Bookmark
- Subscribe
- Mute
- Subscribe to RSS Feed
- Permalink
- Notify Moderator
CPU usage 100% for Thingworx Postgresql
Hi,
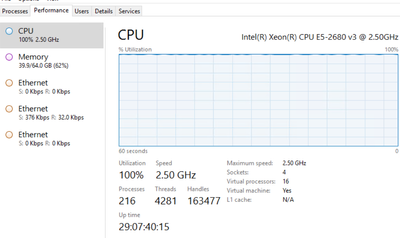
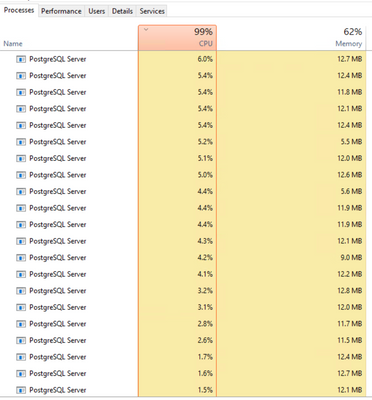
In customer's system, the CPU usage is 100% because of the processes of PostgreSQL.
- If restart the postgresql service , then the cpu usage will creep to 100% in about 10~15 minutes
- The event processing subsystem received 1.5 tasks per seconds . The active threads will increase until 75 (see the attached picture )
- Thingworx can work about 1 hour when cpu is 100% , then will found lots of error "Connection to localhost:5432 refused" in ErrorLog.log .
- No dead lock found by running the sql "select pid,
usename,
pg_blocking_pids(pid) as blocked_by,
query as blocked_query
from pg_stat_activity
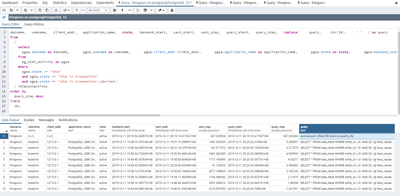
where cardinality(pg_blocking_pids(pid)) > 0;" - Query the table pg_stat_activity, found lots of long xact_stay, but no long query_stay. (see the attached picture )
- CPU usage. (see the attached picture )
Any idea about it ? The workload is not so heavy , why is the CPU usage so high?
----------------------Version-----------------------------------
Thingworx 8.4.4, Windows server 2016, Postgresql 10.7
Regards,
Sean
Solved! Go to Solution.
- Labels:
-
Troubleshooting
- Tags:
- rx
Accepted Solutions
- Mark as New
- Bookmark
- Subscribe
- Mute
- Subscribe to RSS Feed
- Permalink
- Notify Moderator
All the transaction shown (aside from autovacuum), seem to be operating against the data_table. There is a know performance issue with this table:
https://www.ptc.com/en/support/article?n=CS261063
I would recommend:
1. Adding the missing index above
2. Running vacuum analyze data_table;
3. Running select entity_id,count(*) from data_table group by entity_id;
If you provide the output for #3, there may be some platform data that could be truncated to speed up these data_table queries.
- Mark as New
- Bookmark
- Subscribe
- Mute
- Subscribe to RSS Feed
- Permalink
- Notify Moderator
Hi @seanccc.
If the response provided by @Tudor helped to resolve your issue, please mark it as the Accepted Solution for the benefit of others with the same problem. If you are still seeing issues, please provide the details of what is occurring since making the recommended changes.
Regards.
--Sharon


