- Community
- ThingWorx
- ThingWorx Developers
- Cannot bind the result from a service to a time se...
- Subscribe to RSS Feed
- Mark Topic as New
- Mark Topic as Read
- Float this Topic for Current User
- Bookmark
- Subscribe
- Mute
- Printer Friendly Page
Cannot bind the result from a service to a time series chart
- Mark as New
- Bookmark
- Subscribe
- Mute
- Subscribe to RSS Feed
- Permalink
- Notify Moderator
Cannot bind the result from a service to a time series chart
Hi there!
I am getting data from another cloud through a service and I can bind the data to a grid but I cannot bind the same data to a time chart series. This is what I'm trying to do:
I have a list bind to a grid and whenever I select one option from the list, the respective data is displayed on the grid. I would like this very same data to be displayed on the chart as well, but I don't get anything. Besides, in the time chart properties I cannot select anything in the X and Y fields, it is blank.
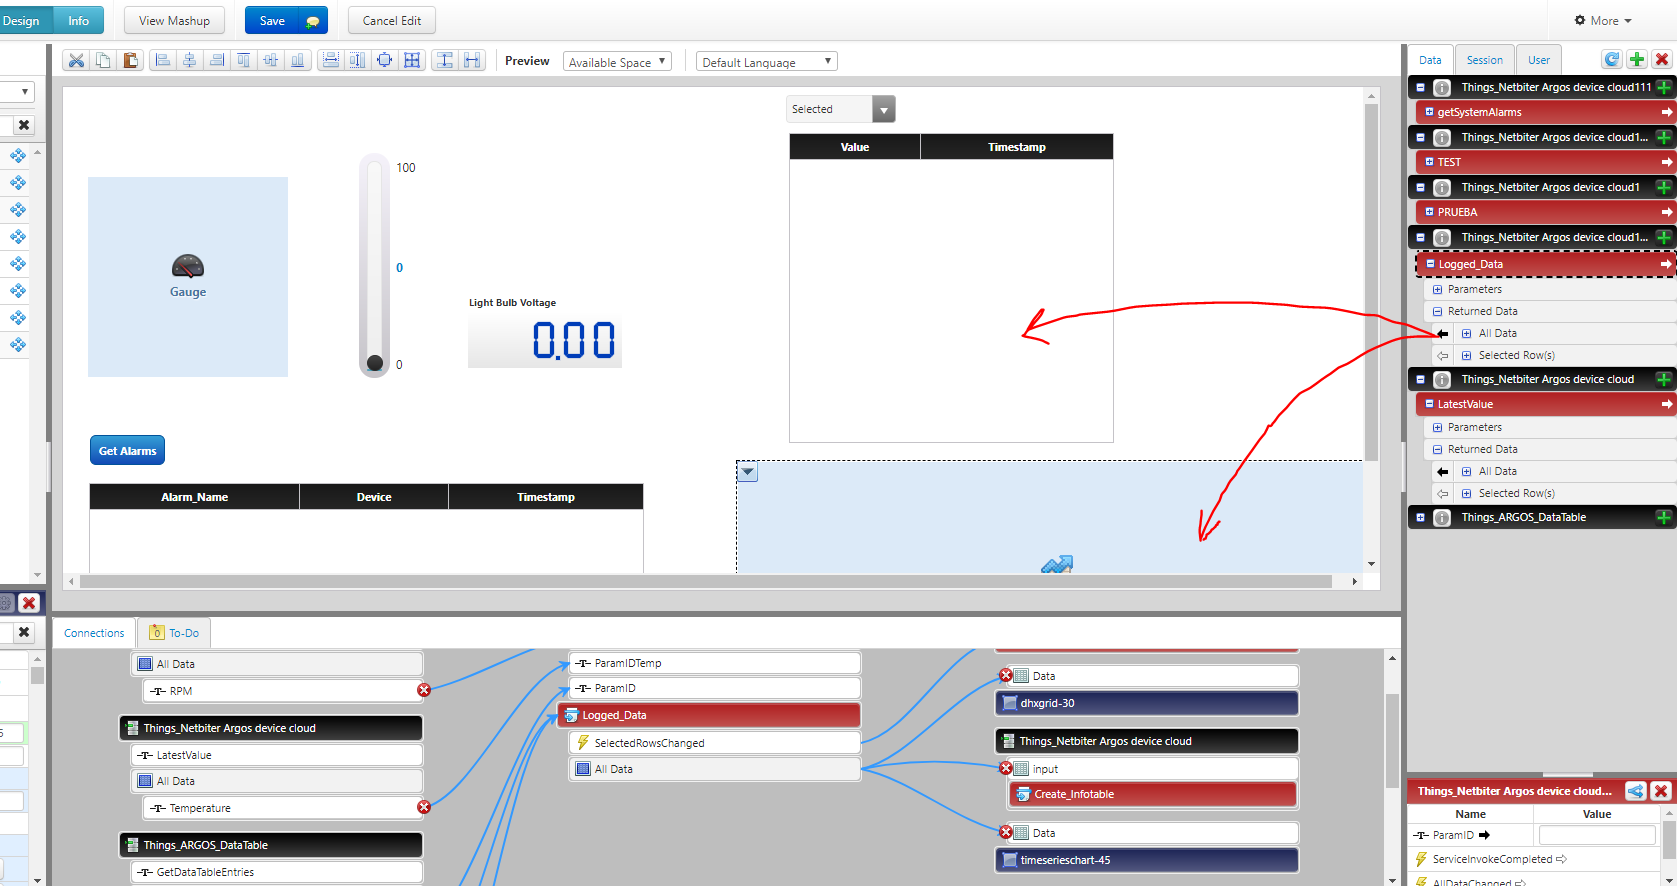
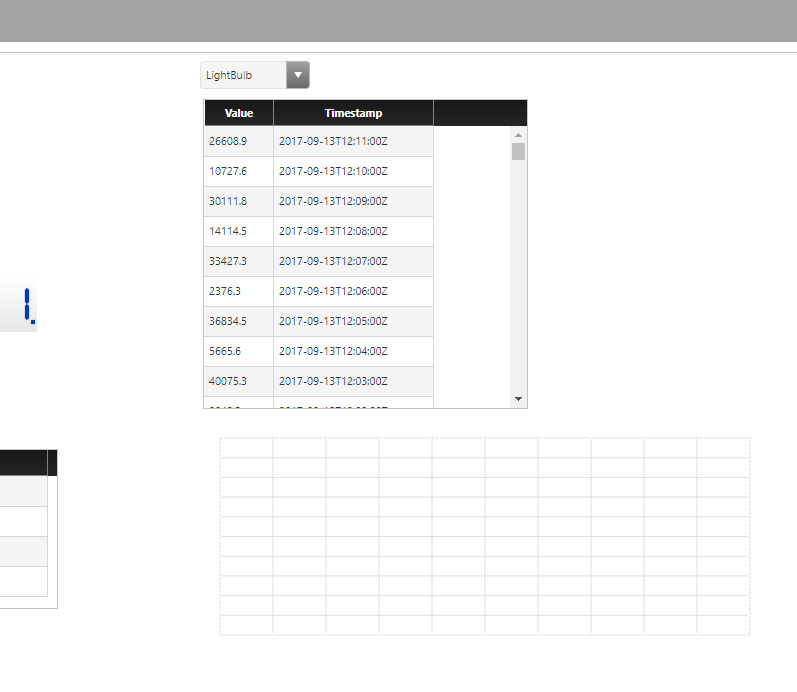
I know how to do this with Kepware but I have no clue about how to do the same thing in this case.
Hope you can help me.
Thanks in advanced!
- Labels:
-
Connectivity
-
Extensions
- Mark as New
- Bookmark
- Subscribe
- Mute
- Subscribe to RSS Feed
- Permalink
- Notify Moderator
Do you have a datashape assigned to the output and if so, is the timestamp a basetype datetime?
- Mark as New
- Bookmark
- Subscribe
- Mute
- Subscribe to RSS Feed
- Permalink
- Notify Moderator
Hi Pai,
Yes, I have.
This is the data shape:
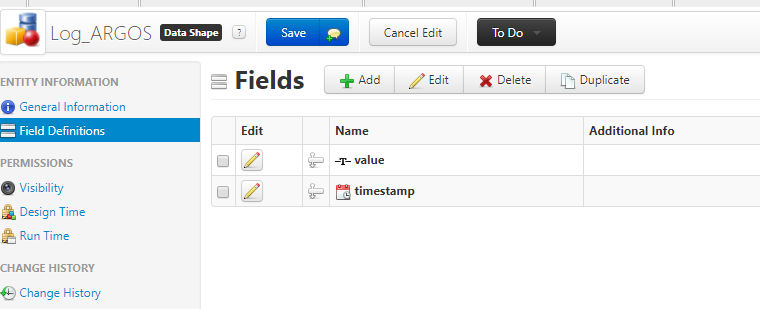
And this is what I get when a call the service in the mashup:
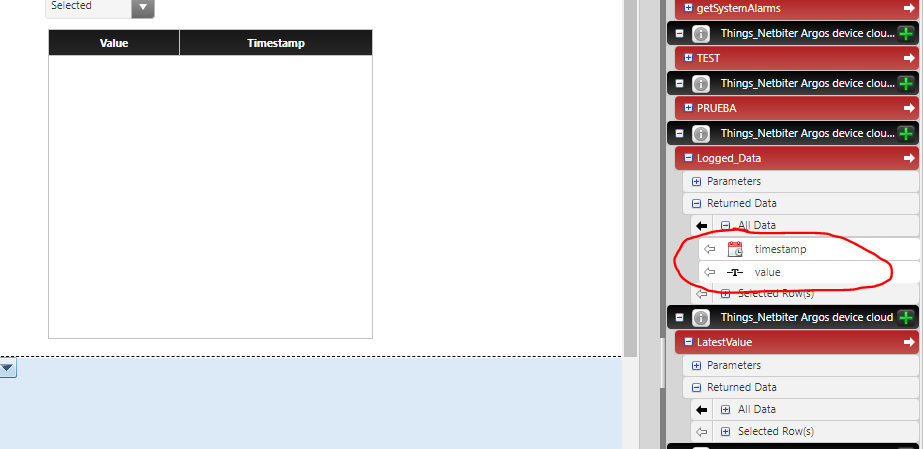
Any clue?
Thanks and best regards.
- Mark as New
- Bookmark
- Subscribe
- Mute
- Subscribe to RSS Feed
- Permalink
- Notify Moderator
Looks like it is actually your Value field, change that to be a Number.
Time series chart can only plot Numbers over time, if you need a String, you can try it with a Label chart?
- Mark as New
- Bookmark
- Subscribe
- Mute
- Subscribe to RSS Feed
- Permalink
- Notify Moderator
Thanks Pai,
Now at least I can see the axis and the legend "value", but the date seems to be invalid.

I have formatted the data as this is how it really comes from the API
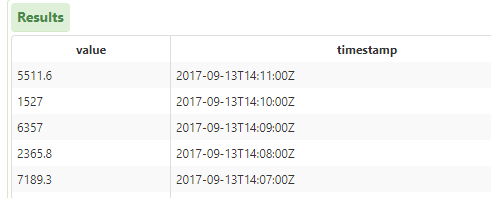
to:
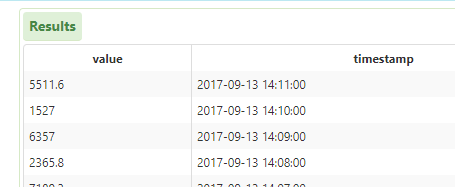
But it is not working either, am I missing something?
- Mark as New
- Bookmark
- Subscribe
- Mute
- Subscribe to RSS Feed
- Permalink
- Notify Moderator
you can try two approaches
1. cast it directly to the datetime field see if it takes
2. you'll need to use the Date() function to convert your data
- Mark as New
- Bookmark
- Subscribe
- Mute
- Subscribe to RSS Feed
- Permalink
- Notify Moderator
Hi Pai,
This is what I get when using Date() function:
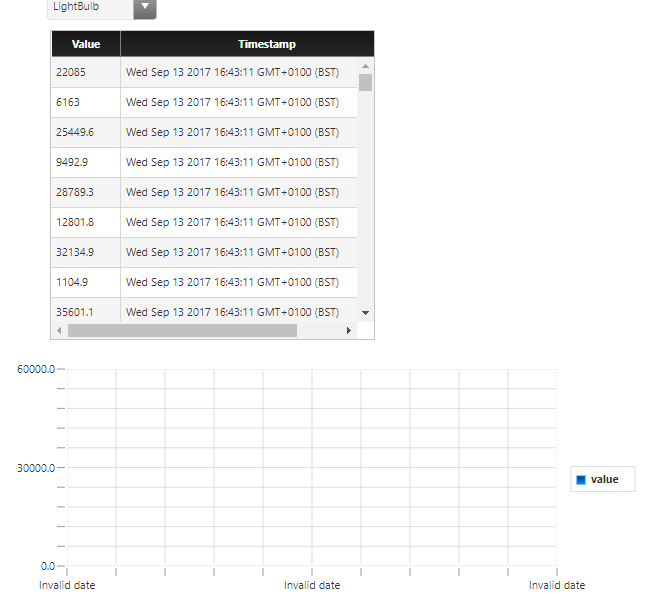
This was my first approach:
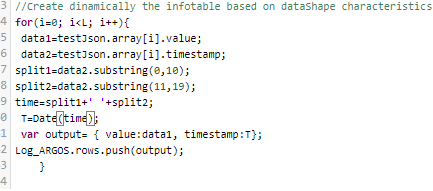
Second approach:
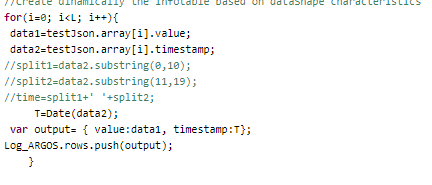
Both produce the same result above.
Thanks.
- Mark as New
- Bookmark
- Subscribe
- Mute
- Subscribe to RSS Feed
- Permalink
- Notify Moderator
The date looks good, how did you define the X axis in the chart properties?
Actually try the following, using the Date() function formatted service.
Remove your time series chart and put a new one in there, drop the data on it and then just view the mashup
- Mark as New
- Bookmark
- Subscribe
- Mute
- Subscribe to RSS Feed
- Permalink
- Notify Moderator
HI,
Not very sure about how to use that service... It is this service, isn't it?
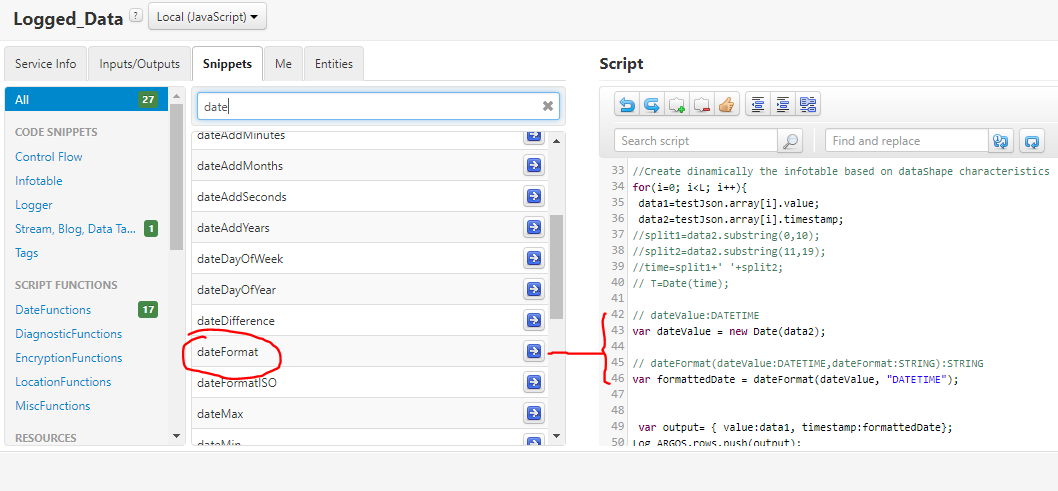
I'm getting an error:
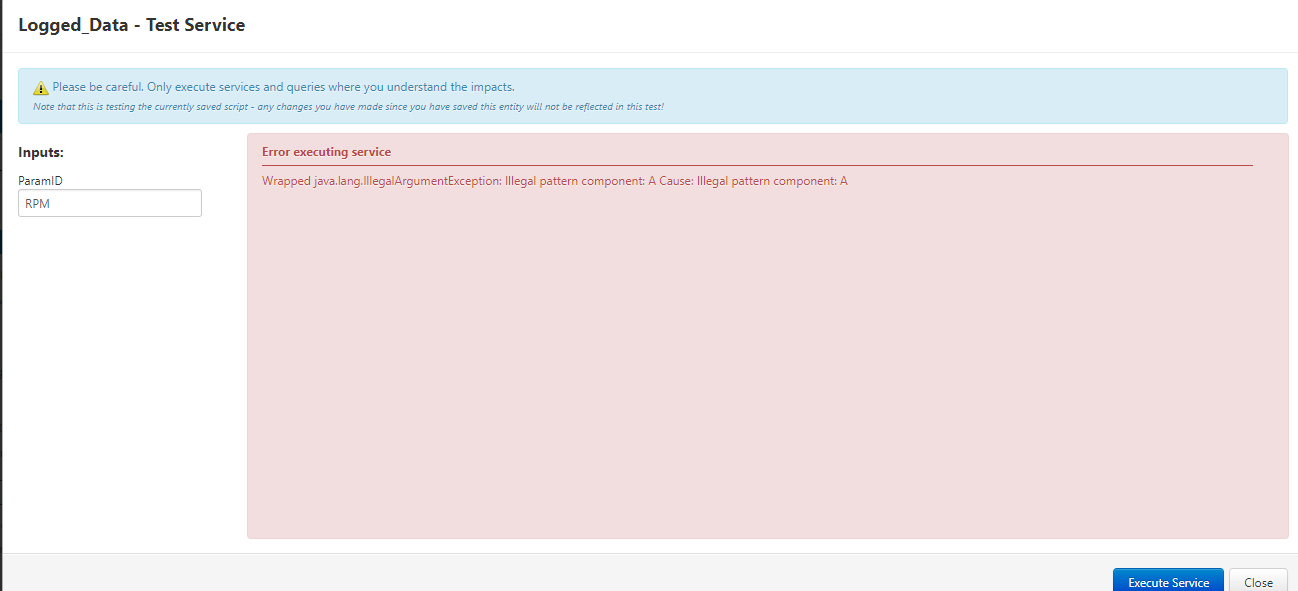
I have also used STRING but same error..
- Mark as New
- Bookmark
- Subscribe
- Mute
- Subscribe to RSS Feed
- Permalink
- Notify Moderator
Just use Date() (java script function)
However that first result looks like a good result that I think Thingworx should be able to use.
- Mark as New
- Bookmark
- Subscribe
- Mute
- Subscribe to RSS Feed
- Permalink
- Notify Moderator
Hi Pai,
I have found finally the problem...a quite silly thing, in the datashape declaration the basetype of timestamp was STRING instead of DATETIME. I just copied and pasted the datashape declaration from other code... lazy girl!!
Now it is working
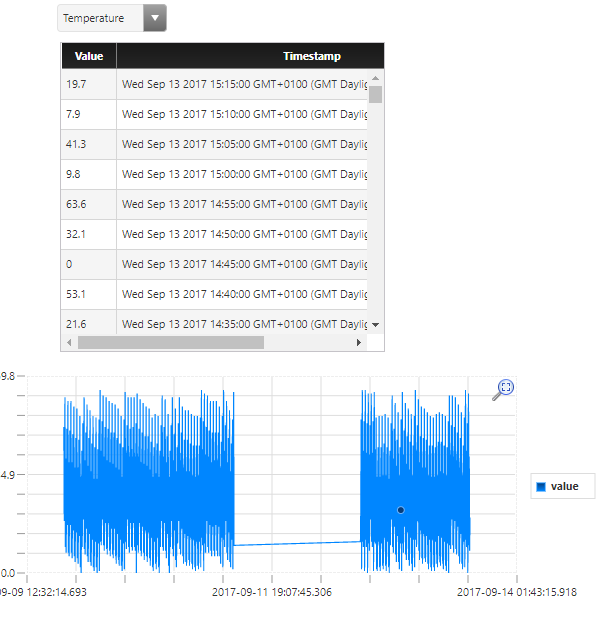
Many thanks for all your help!!
Best regards.


