

Question
Cannot bind the result from a service to a time series chart
Hi there!
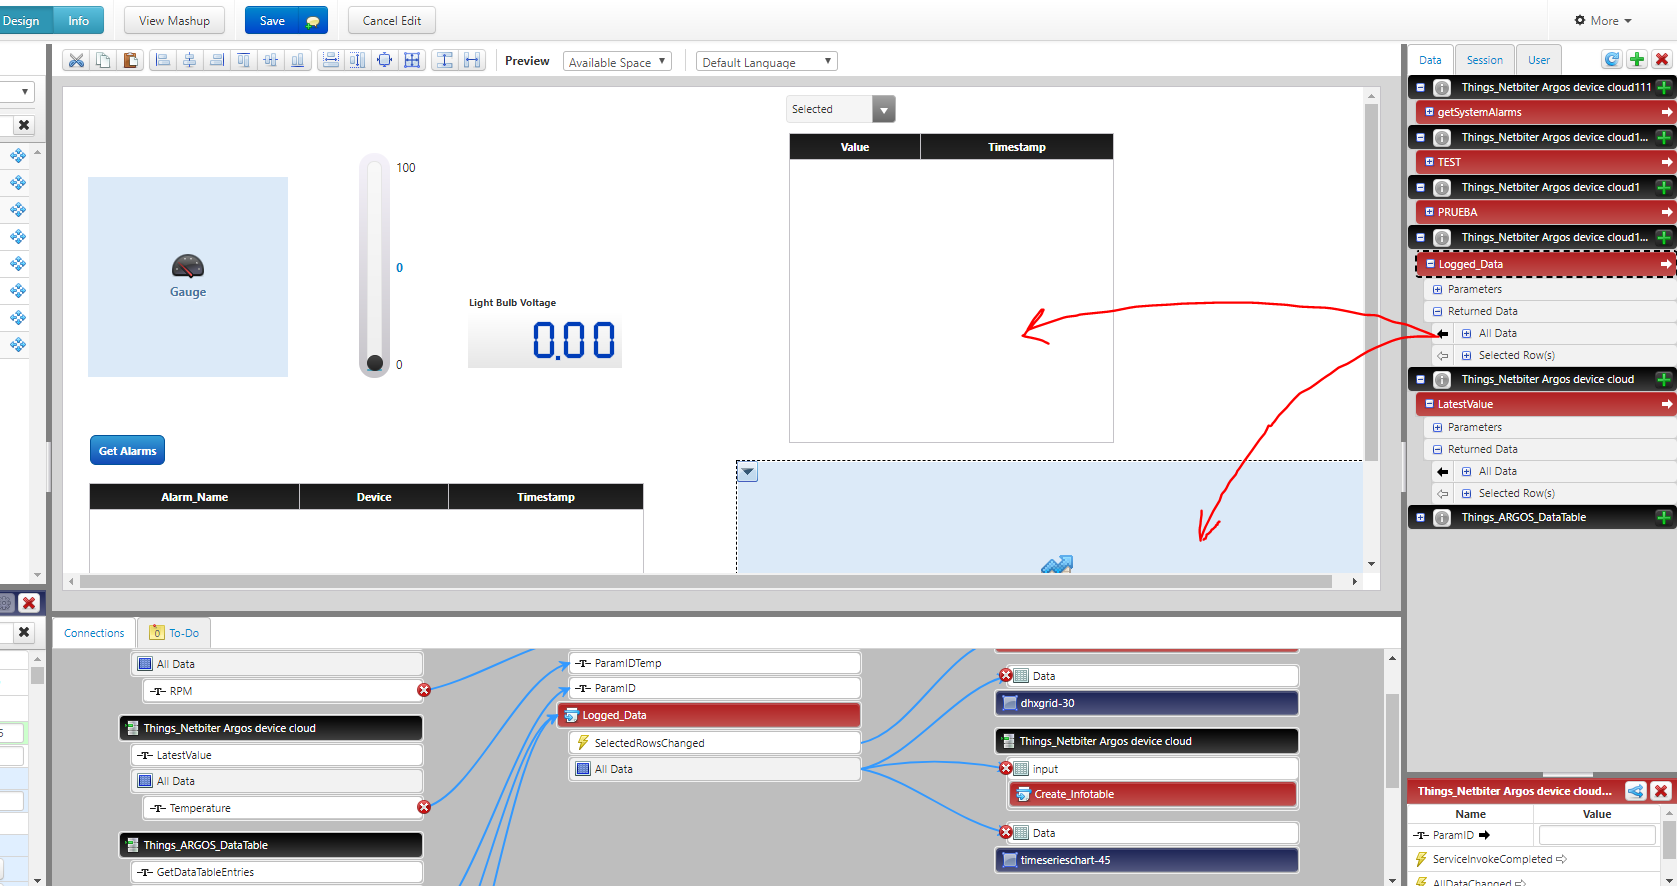
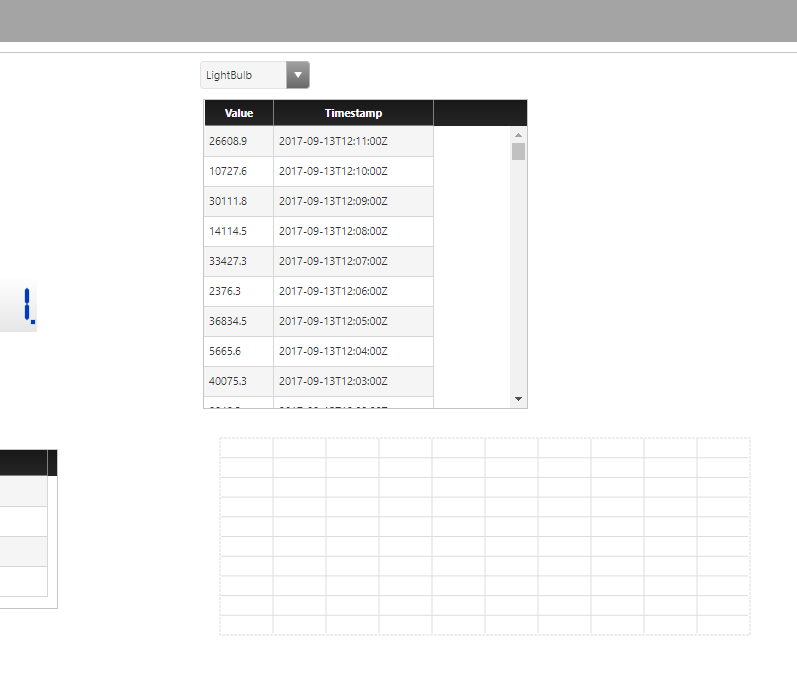
I am getting data from another cloud through a service and I can bind the data to a grid but I cannot bind the same data to a time chart series. This is what I'm trying to do:
I have a list bind to a grid and whenever I select one option from the list, the respective data is displayed on the grid. I would like this very same data to be displayed on the chart as well, but I don't get anything. Besides, in the time chart properties I cannot select anything in the X and Y fields, it is blank.
I know how to do this with Kepware but I have no clue about how to do the same thing in this case.
Hope you can help me.
Thanks in advanced!