- Community
- ThingWorx
- ThingWorx Developers
- Custom Timeseries chart does not respect AutoScale...
- Subscribe to RSS Feed
- Mark Topic as New
- Mark Topic as Read
- Float this Topic for Current User
- Bookmark
- Subscribe
- Mute
- Printer Friendly Page
Custom Timeseries chart does not respect AutoScale off option
- Mark as New
- Bookmark
- Subscribe
- Mute
- Subscribe to RSS Feed
- Permalink
- Notify Moderator
Custom Timeseries chart does not respect AutoScale off option
Hi Guys,
I am using custom chart widgets and I have issue with timeseries chart.
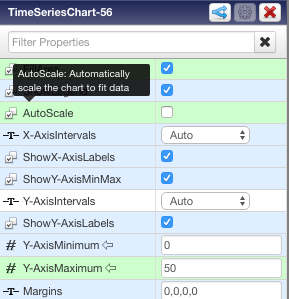
From normal timeseries chart I am used to set my YAxis fixed, i.e. 0 min 100 max. (YAxisAutoscale off).
At custom TSCh looks like this

but no matter what I do (check, it uncheck it), set Ymax to 50 even though that my data are exceeding this value.
It always looks the same, is changes the Yaxis to fit the data..
What am I missing? Thanks a lot. Another issue is that label is not showing the Date portion of datetime..

- Labels:
-
Mashup-Widget
- Mark as New
- Bookmark
- Subscribe
- Mute
- Subscribe to RSS Feed
- Permalink
- Notify Moderator
I'm not sure how much help I could be without seeing the source code, but are you sure you aren't setting the auto scale property somewhere in the custom code?
- Mark as New
- Bookmark
- Subscribe
- Mute
- Subscribe to RSS Feed
- Permalink
- Notify Moderator
Sorry Marked the answer as correct. Done that by mistake.
There is NO source code. I am merely referring to Custom Chart Widgets (https://marketplace.thingworx.com/Items/Custom%20Chart%20Widgets).
Used as they are...
Can someone confirm this bahavior?


