- Community
- ThingWorx
- ThingWorx Developers
- Re: Generating widgets/ gadgets automatically
- Subscribe to RSS Feed
- Mark Topic as New
- Mark Topic as Read
- Float this Topic for Current User
- Bookmark
- Subscribe
- Mute
- Printer Friendly Page
Generating widgets/ gadgets automatically
- Mark as New
- Bookmark
- Subscribe
- Mute
- Subscribe to RSS Feed
- Permalink
- Notify Moderator
Generating widgets/ gadgets automatically
Hello PTC community
i hope you are doing well. I have a question regarding the automatic generation of gadgets and widgets.
E.g.
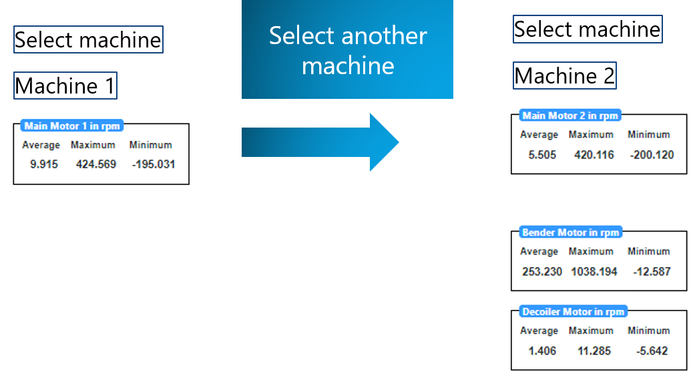
In my mashup I am showing motor values from different motors from different machines.
Machine 1 has 5 motors and machine 2 has 10 motors for example.
Through a dropdown widget I want to choose the machine and according to that my mashup should show now a different number of motor widgets/gadgets. See attached image.
How can I achieve this functionality?
Thanks in advance.
- Labels:
-
Design
-
Mashup-Widget
- Mark as New
- Bookmark
- Subscribe
- Mute
- Subscribe to RSS Feed
- Permalink
- Notify Moderator
Have your different machine data(infotable) mapped to a drop-down. With this service, you will have the "SelectedRowsChanged" event which you can further use to execute another service that will bring all the motor data corresponding to that machine. Pass the machine name from "name" field of Selected Row(s) to the next service(which will bring motor data for a machine) and execute the service on SelectedRowsChanged event of the first service. With this concept, as soon as the user selects a machine from drop down motors data will be there corresponding to that machine. To display different motor data you can use collection widget which will automatically replicate a base mashup (Average,minimum, maximum) according to different number of rows.
- Mark as New
- Bookmark
- Subscribe
- Mute
- Subscribe to RSS Feed
- Permalink
- Notify Moderator
Thank you very much for the fast feedback. I get that i will list up the machines in the drop down. Then a service will based on this machines and their corresponding motor properties write these values (average, minimum, maximum) to a infotable. Then the collection widget will do the rest. But how will i do this for example if i have data which cannnot be saved to a infotable like timeseries data which is stored into a valuestream which i want to show multiple times in a linechart?
- Mark as New
- Bookmark
- Subscribe
- Mute
- Subscribe to RSS Feed
- Permalink
- Notify Moderator
As far as I can understand from your above statement, it seems like every motor is an asset that is storing its properties in a value stream. If that's the case, then it will be a bit tricky to map different motor data on multiple charts using the collection widget. I believe the issue will not be about saving the data in infotable, as the API which brings the data from the value stream also return an infotable. If you would go with the collection approach I believe there can be performance issues as I am not sure how much historical data you would fetch in a single call and how many max motors would be there per machine. I hope my understanding is correct, if not please elaborate on your use case more.
- Mark as New
- Bookmark
- Subscribe
- Mute
- Subscribe to RSS Feed
- Permalink
- Notify Moderator
Hi thanks again for the fast feedback. A motor is not an asset but an property. A machine is an asset and every machine has a different number of motors where each motor is a property and therefore has a valuestream.
- Mark as New
- Bookmark
- Subscribe
- Mute
- Subscribe to RSS Feed
- Permalink
- Notify Moderator
Hi @AS_9770512.
What frequency are you using for gathering data from the motor? You might be able to store the average/min/max as a property on the machine and read the values from the property. Do you immediately need to see the average/min/max for all motors?
Regards.
--Sharon


