
Turn on suggestions
Auto-suggest helps you quickly narrow down your search results by suggesting possible matches as you type.
Showing results for
Please log in to access translation
Turn on suggestions
Auto-suggest helps you quickly narrow down your search results by suggesting possible matches as you type.
Showing results for
- Community
- ThingWorx
- ThingWorx Developers
- Graphing NumberArrayElement or Creating a Value St...
Translate the entire conversation x
Please log in to access translation
Options
- Subscribe to RSS Feed
- Mark Topic as New
- Mark Topic as Read
- Float this Topic for Current User
- Bookmark
- Subscribe
- Mute
- Printer Friendly Page
Graphing NumberArrayElement or Creating a Value Stream for a Float Array
Nov 27, 2019
02:40 PM
- Mark as New
- Bookmark
- Subscribe
- Mute
- Subscribe to RSS Feed
- Permalink
- Notify Moderator
Please log in to access translation
Nov 27, 2019
02:40 PM
Graphing NumberArrayElement or Creating a Value Stream for a Float Array
Hello,
I am very new to ThingWorx,
I am trying to graph data that is in an array that is being imported from a plc.
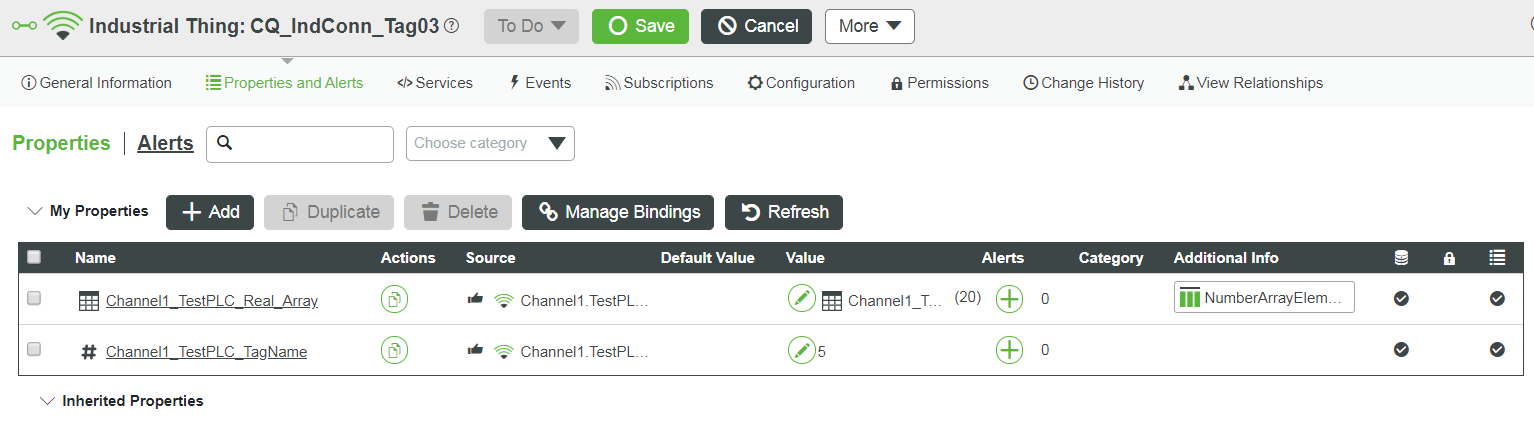
I managed to map the float array to ThingWorx as an "Industrial Thing", on the Properties and Alerts page, I can refresh and I can see the values are updating. My array is 20 long. The value area shows the image associated with an info table, and the additional info shows it as a NumerArrayElement.
I want to create a time series chart that trends the values of each of these on one chart vs the timestamp.
I have created a value stream for a single float to do this function with already, but I want to streamline this process by using an array of floats.
I am sure that I need to make a value stream of sorts, but I am not sure where to get started.
Thank you.
Labels:
- Labels:
-
Design
1 REPLY 1
Jan 20, 2020
03:58 PM
- Mark as New
- Bookmark
- Subscribe
- Mute
- Subscribe to RSS Feed
- Permalink
- Notify Moderator
Please log in to access translation
Jan 20, 2020
03:58 PM
Hello mbrosius,
I know it has been sometime since you had initially posted this and I wanted to determine if you were able to determine what is necessary to properly graph your data in a Mashup.
If you are able to get the data to display on the Remotely Bound Property of the Industrial Thing as desired then you will simply need to associate the Industrial Thing with a Value Stream. You can then bind the QueryInfoTablePropertyHistory service with the proper input parameters on the Industrial Thing to the desired chart widget on the Mashup.


