- Community
- ThingWorx
- ThingWorx Developers
- Re: How can I reset the QueryPropertyHistory?
- Subscribe to RSS Feed
- Mark Topic as New
- Mark Topic as Read
- Float this Topic for Current User
- Bookmark
- Subscribe
- Mute
- Printer Friendly Page
How can I reset the QueryPropertyHistory?
- Mark as New
- Bookmark
- Subscribe
- Mute
- Subscribe to RSS Feed
- Permalink
- Notify Moderator
How can I reset the QueryPropertyHistory?
Hi.
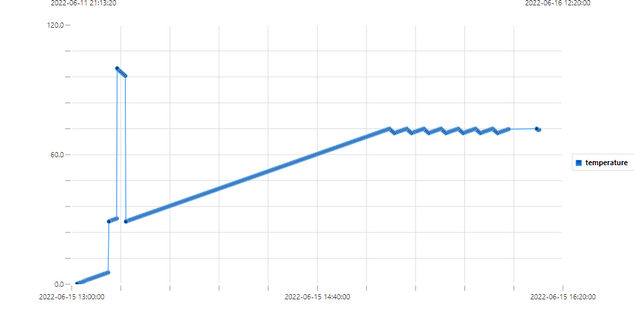
What I'm trying to do is showing a time series chart in real time. I read that I can use the thing service "QueryPropertyHistory" with a property of the same thing. When I use it a can show all the data recieved from KepServerEX and they're like stored in thingworx and showed in the time series chart from the begining (when I set the property to logged and persistent) to now (I use an auto refresh widget to update the service), But What I want to do is that when I open the mashup, I want the data stored of the property to be restarted and start storing again and show data of the moment.
For example, I set the property to logged and persistent since 1 PM and I have al the data since that hour, but what I want is that data to be reseted when I open the mashup and start to store the data.
Is there a way I can do this? is this a good practice to graph in real time? or there is another way to show data in a time series chart in real time?
I Hope you understand me and I'm sorry if this is a silly question, I'm newie
Thank you.
Valeria
Solved! Go to Solution.
- Labels:
-
Best Practices
-
Design
-
Examples
Accepted Solutions
- Mark as New
- Bookmark
- Subscribe
- Mute
- Subscribe to RSS Feed
- Permalink
- Notify Moderator
@VCortes2203 Querypropertyhistory also has a startdate parameter where you can pass the current date and time . It will show only data which has been logged from the start date and time which you have passed.
- Mark as New
- Bookmark
- Subscribe
- Mute
- Subscribe to RSS Feed
- Permalink
- Notify Moderator
Thanks @abjain it works. I have another question, this data is logged in thingworx memory, am I right?, so is there a problem to stored always de data? I'm worry about the memory because I don't have so much memory and I get the data very often, or there is a way to clean the stored data?
- Mark as New
- Bookmark
- Subscribe
- Mute
- Subscribe to RSS Feed
- Permalink
- Notify Moderator
@VCortes2203 This data is stored in database and not in memory. There is a value_stream table in database where it gets stored


