
Turn on suggestions
Auto-suggest helps you quickly narrow down your search results by suggesting possible matches as you type.
Showing results for
Please log in to access translation
Turn on suggestions
Auto-suggest helps you quickly narrow down your search results by suggesting possible matches as you type.
Showing results for
- Community
- ThingWorx
- ThingWorx Developers
- Re: How to show Fast Fourier transform for a set o...
Translate the entire conversation x
Please log in to access translation
Options
- Subscribe to RSS Feed
- Mark Topic as New
- Mark Topic as Read
- Float this Topic for Current User
- Bookmark
- Subscribe
- Mute
- Printer Friendly Page
How to show Fast Fourier transform for a set of readings from accelerometer in mash up?
Apr 26, 2017
02:05 AM
- Mark as New
- Bookmark
- Subscribe
- Mute
- Subscribe to RSS Feed
- Permalink
- Notify Moderator
Please log in to access translation
Apr 26, 2017
02:05 AM
How to show Fast Fourier transform for a set of readings from accelerometer in mash up?
Hi,
I have a set of readings from accelerometer. These readings are acceleration of vibrations. How can I use these readings and draw FFT and show it on mash up?
Thanks,
Azim
Solved! Go to Solution.
Labels:
- Labels:
-
Mashup-Widget
ACCEPTED SOLUTION
Accepted Solutions
Apr 26, 2017
09:00 AM
- Mark as New
- Bookmark
- Subscribe
- Mute
- Subscribe to RSS Feed
- Permalink
- Notify Moderator
Please log in to access translation
Apr 26, 2017
09:00 AM
change the seriesType1 property of the xy widget to line to get a line.
11 REPLIES 11
Apr 26, 2017
02:46 AM
- Mark as New
- Bookmark
- Subscribe
- Mute
- Subscribe to RSS Feed
- Permalink
- Notify Moderator
Please log in to access translation
Apr 26, 2017
02:46 AM
Hi Azim, have you already connected the accelerometer to ThingWorx? How are you currently getting and storing the data in ThingWorx?
Apr 26, 2017
03:16 AM
- Mark as New
- Bookmark
- Subscribe
- Mute
- Subscribe to RSS Feed
- Permalink
- Notify Moderator
Please log in to access translation
Apr 26, 2017
03:16 AM
Hi Sushant,
I have not connected yet. I am thinking of using JAVA SDK and connect accelerometer to SDK and from SDK push the data to thingworx platform. I am a newbie to thingworx. Can you help me how should I achieve this?
Thanks,
Azim
Apr 26, 2017
03:25 AM
- Mark as New
- Bookmark
- Subscribe
- Mute
- Subscribe to RSS Feed
- Permalink
- Notify Moderator
Please log in to access translation
Apr 26, 2017
03:25 AM
Azim, I'm not sure what sort of device it is but you can consider using ThingWorx's C SDK or ThingWorx WS EMS for streaming the reading data to ThingWorx. Both of these SDKs are suitable for supporting the devices which inherently lack the computation power. Indeed you can use the ThingWorx Java SDK if you see that fit for your scenario.
If you are starting afresh with the connectivity I would recommend you to go through the Homepage - Developer Zone : ThingWorx and check the Connectivity section it include the learning labs and other must have information for you. If you are connecting your device to something like RaspberryPi or Arduino you can try referencing this great postUsing the C SDK to Deliver Data to ThingWorx from a Raspberry PI
Once you are decided on which SDK to go with, reading data could be logged to a ValueStream, i.e. if you are looking to continue monitoring the readings every n number of seconds/minutes. I think you will also need a custom JS script for implementing the algorithm on processing the reading which you are getting from the accelerometer before you can log that onto any widget, again this part will depend how you are post processing the data you are receiving from the device.
Apr 26, 2017
03:31 AM
- Mark as New
- Bookmark
- Subscribe
- Mute
- Subscribe to RSS Feed
- Permalink
- Notify Moderator
Please log in to access translation
Apr 26, 2017
03:31 AM
Hi Sushant,
Thanks for giving me some heads up, I will start with this and let you know if am facing any issues. Also, can you suggest me how to show this data on mashup?
Thanks,
Azim
Apr 26, 2017
03:03 AM
- Mark as New
- Bookmark
- Subscribe
- Mute
- Subscribe to RSS Feed
- Permalink
- Notify Moderator
Please log in to access translation
Apr 26, 2017
03:03 AM
Hi azim hawaldar,
You can use the gauge widget to show the current acceleration and if you are logging the readings from accelerometer; you can use Time Series chart to show the variation.
Do let us know if you have any specific question on implementation.
Apr 26, 2017
03:18 AM
- Mark as New
- Bookmark
- Subscribe
- Mute
- Subscribe to RSS Feed
- Permalink
- Notify Moderator
Please log in to access translation
Apr 26, 2017
03:18 AM
Hi Ankit,
In FFT there is no concept of time. So time series will not work. I should plot amplitude versus frequency.
Thanks,
Azim
Apr 26, 2017
03:35 AM
- Mark as New
- Bookmark
- Subscribe
- Mute
- Subscribe to RSS Feed
- Permalink
- Notify Moderator
Please log in to access translation
Apr 26, 2017
03:35 AM
You can use xy chart to plot amplitude versus frequency on Mashup
Apr 26, 2017
03:38 AM
- Mark as New
- Bookmark
- Subscribe
- Mute
- Subscribe to RSS Feed
- Permalink
- Notify Moderator
Please log in to access translation
Apr 26, 2017
03:38 AM
For more information on xy chart please check PTC and search for XY chart widget.
Apr 26, 2017
08:09 AM
- Mark as New
- Bookmark
- Subscribe
- Mute
- Subscribe to RSS Feed
- Permalink
- Notify Moderator
Please log in to access translation
Apr 26, 2017
08:09 AM
Hello Ankit Gupta,
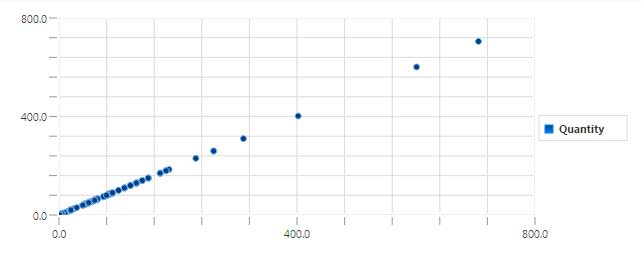
I did saw the XY chart widget, but this widget is not meeting my requirement. I would like to have something like this
But what XY chart does is as below.
Apr 26, 2017
09:00 AM
- Mark as New
- Bookmark
- Subscribe
- Mute
- Subscribe to RSS Feed
- Permalink
- Notify Moderator
Please log in to access translation
Apr 26, 2017
09:00 AM
change the seriesType1 property of the xy widget to line to get a line.
Apr 27, 2017
02:41 AM
- Mark as New
- Bookmark
- Subscribe
- Mute
- Subscribe to RSS Feed
- Permalink
- Notify Moderator
Please log in to access translation


