- Community
- ThingWorx
- ThingWorx Developers
- Re: I now want to see the values inside the infota...
- Subscribe to RSS Feed
- Mark Topic as New
- Mark Topic as Read
- Float this Topic for Current User
- Bookmark
- Subscribe
- Mute
- Printer Friendly Page
I now want to see the values inside the infotable and use this values to plot XY chart.
- Mark as New
- Bookmark
- Subscribe
- Mute
- Subscribe to RSS Feed
- Permalink
- Notify Moderator
I now want to see the values inside the infotable and use this values to plot XY chart.
Hi Sushant Pandey, Ankit Gupta,
I was now able to send infotable to the platform. I now want to see the values inside the infotable and use this values to plot XY chart. Can you help me on this? Please.
Message was edited by: Sushant Pandey branched from related thread https://community.thingworx.com/thread/41376
- Labels:
-
Connectivity
- Mark as New
- Bookmark
- Subscribe
- Mute
- Subscribe to RSS Feed
- Permalink
- Notify Moderator
Azim, you can use a Grid and XY Widget in a Mashup this will show you the values you are getting and how they are being represented in the Mashup. You can refer to the Grid Widget documentation for more detail. I believe for XY widget you already got it working from your other thread How to show Fast Fourier transform for a set of readings from accelerometer in mash up?
- Mark as New
- Bookmark
- Subscribe
- Mute
- Subscribe to RSS Feed
- Permalink
- Notify Moderator
Hi Sushant Pandey,
My data is something like this. However I cannot see this data in grid widget. I do not know what I am doing wrong here.
| -0.022 | -0.039 |
| -0.105 | -0.017 |
| -0.183 | -0.098 |
| -0.178 | -0.161 |
| -0.208 | -0.129 |
- Mark as New
- Bookmark
- Subscribe
- Mute
- Subscribe to RSS Feed
- Permalink
- Notify Moderator
Could you share the bindings for your Grid widget you have, may be screenshot if its okay for you as to what exactly is shown on the grid when you try to view it?
- Mark as New
- Bookmark
- Subscribe
- Mute
- Subscribe to RSS Feed
- Permalink
- Notify Moderator
Hi Sushant Pandey,
I will explain in depth with screenshots.
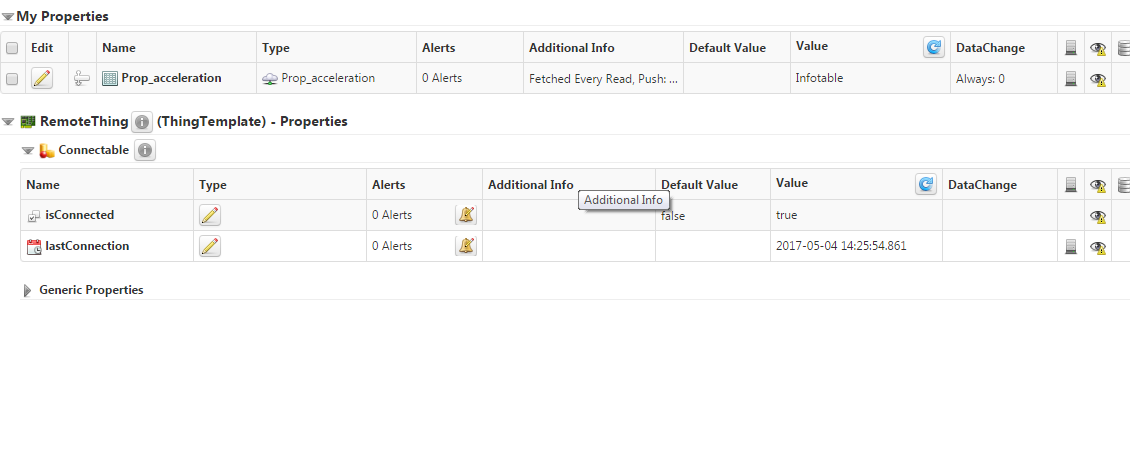
1) I created a virtual thing using java sdk . It has one property by name "Prop_acceleration" and baseType as InfoTable. This is being pushed to plaform. This is working as expected. Screen shot is as below.

2) Next I created a service by name GetXAxis and output of this as INFOTABLEand code snippet is as below
var myInfoTable=me.Prop_acceleration;
var result=myInfoTable;
When I executed this service. I saw that output is as expected.
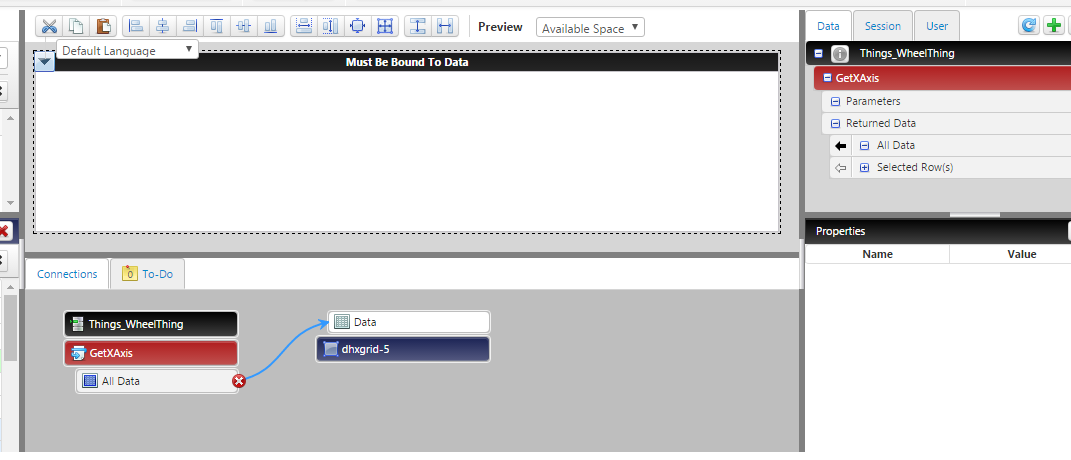
3) Next i want to use this service output and display on grid widget . Here I am strucked. Below is the screen shot
- Mark as New
- Bookmark
- Subscribe
- Mute
- Subscribe to RSS Feed
- Permalink
- Notify Moderator
- Mark as New
- Bookmark
- Subscribe
- Mute
- Subscribe to RSS Feed
- Permalink
- Notify Moderator
Hello, when you execute the service GetXAxis in composer from the WheelThing, can you get the good result ?
- Mark as New
- Bookmark
- Subscribe
- Mute
- Subscribe to RSS Feed
- Permalink
- Notify Moderator
Hi Quang-Dung Ngo,
I can see the result when I execute GetXAxis in composer from the WheelThing, but How can I use these values to plot in XY chart.
Thanks,
Azim
- Mark as New
- Bookmark
- Subscribe
- Mute
- Subscribe to RSS Feed
- Permalink
- Notify Moderator
Azim, you'll need the XY chart like discussed in How to show Fast Fourier transform for a set of readings from accelerometer in mash up? and bind your returned result to the chart.
What's the result of the service which is used in the screenshot for binding to the grid widget? What's the return baseType for that service? If its an infotable what datashape is assigned to it?
Grid widget will display the values in same format as the datashape assigned to your infotable.
- Mark as New
- Bookmark
- Subscribe
- Mute
- Subscribe to RSS Feed
- Permalink
- Notify Moderator
hi Sushant Pandey,
The baseType for output of service is InfoTable. Since the thing is a virtual thing, infoTable for a property of a thing is created without datashape.
Thanks,
Azim
- Mark as New
- Bookmark
- Subscribe
- Mute
- Subscribe to RSS Feed
- Permalink
- Notify Moderator
You'll need datashape assigned to the service's returned infotable, as Grid will use that to plot values returned by your service
- Mark as New
- Bookmark
- Subscribe
- Mute
- Subscribe to RSS Feed
- Permalink
- Notify Moderator
Hi azim hawaldar,
Make sure you use Mashup Loaded checked to invoke the service on Mashup Load.
Secondly, make sure your service has a DataShape else select Show all columns option of grid to show data when DataShape is not available.


