- Community
- ThingWorx
- ThingWorx Developers
- Label Chart has duplicate entries
- Subscribe to RSS Feed
- Mark Topic as New
- Mark Topic as Read
- Float this Topic for Current User
- Bookmark
- Subscribe
- Mute
- Printer Friendly Page
Label Chart has duplicate entries
- Mark as New
- Bookmark
- Subscribe
- Mute
- Subscribe to RSS Feed
- Permalink
- Notify Moderator
Label Chart has duplicate entries
Hello,
I am trying to graph the results of a QueryNamedPropertyHistory service call.
When I test the service on my thing, the infotable returned looks like this:

The data points have identical timestamps because they are added to the stream in a custom service with the same date/time object passed in the params. So there are not duplicate entries in the infotable.
But when I bind the results to a label chart in a mashup, I get duplicate data points:

Does anyone know why this is happening? The data values and timestamps are exactly the same in the duplicates. I'm wondering if I just have a weird setting that I need to change.
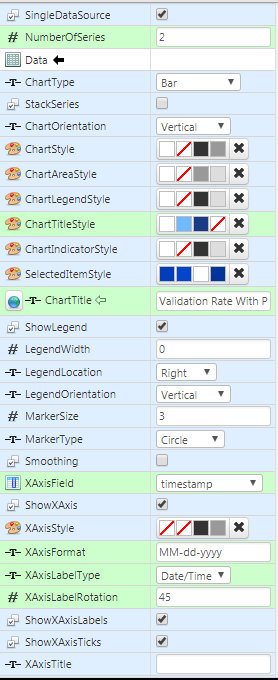
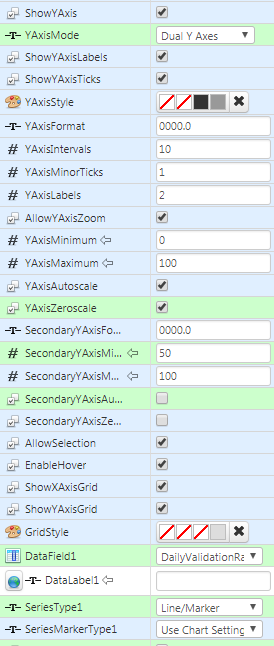
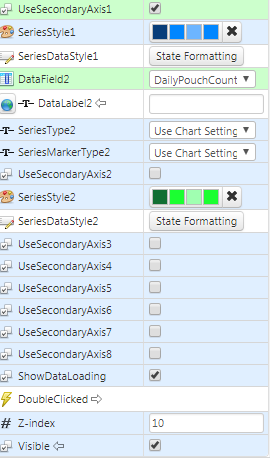
Here is a screenshot of my property settings:


Thank you
Jenna
Solved! Go to Solution.
- Labels:
-
Mashup-Widget
Accepted Solutions
- Mark as New
- Bookmark
- Subscribe
- Mute
- Subscribe to RSS Feed
- Permalink
- Notify Moderator
Pai,
Your suggestion made me have an epiphany without even implementing it. I realize that this service is returning other properties that weren't being updated with the same date/time stamp. So just because I don't use them in the graph doesn't mean there won't be rows for each timestamp... if that makes sense. Anyway, the solution is to make sure those are the only two properties being passed as parameters for the service call.
Thank you,
Jenna
- Mark as New
- Bookmark
- Subscribe
- Mute
- Subscribe to RSS Feed
- Permalink
- Notify Moderator
Just to double check can you put the data in a grid as well next to the chart to make sure you aren't somehow receiving those entries in the mashup, even though the service seems to not be doing it.
- Mark as New
- Bookmark
- Subscribe
- Mute
- Subscribe to RSS Feed
- Permalink
- Notify Moderator
Pai,
Your suggestion made me have an epiphany without even implementing it. I realize that this service is returning other properties that weren't being updated with the same date/time stamp. So just because I don't use them in the graph doesn't mean there won't be rows for each timestamp... if that makes sense. Anyway, the solution is to make sure those are the only two properties being passed as parameters for the service call.
Thank you,
Jenna


