
Turn on suggestions
Auto-suggest helps you quickly narrow down your search results by suggesting possible matches as you type.
Showing results for
Please log in to access translation
Turn on suggestions
Auto-suggest helps you quickly narrow down your search results by suggesting possible matches as you type.
Showing results for
- Community
- ThingWorx
- ThingWorx Developers
- Re: Line Chart X-Axis limits not working correctly
Translate the entire conversation x
Please log in to access translation
Options
- Subscribe to RSS Feed
- Mark Topic as New
- Mark Topic as Read
- Float this Topic for Current User
- Bookmark
- Subscribe
- Mute
- Printer Friendly Page
Line Chart X-Axis limits not working correctly
Nov 10, 2020
04:16 AM
- Mark as New
- Bookmark
- Subscribe
- Mute
- Subscribe to RSS Feed
- Permalink
- Notify Moderator
Please log in to access translation
Nov 10, 2020
04:16 AM
Line Chart X-Axis limits not working correctly
Hello everyone,
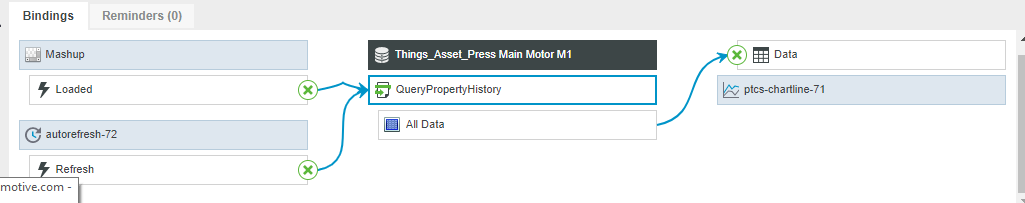
I have a simple mashup where I want to display data coming from a value stream. I have a remote thing connected to a KepServer Gateway that retrieves sensor data each second. In the mashup builder, I add the queryPropertyHistory service for the data.
Now I insert the Line Chart (Version is Thingworx 9) and link the data from the query to the chart (I choose three signals for the Y Axis and the timestamp (DATETIME) for the X Axis. I also choose maxItems for the query (e.g. 1000).
Now when I open the mashup, the data is loaded and shown properly and is also refreshing and adding the latest data each second. The problem is, that the X-Axis is way to widely scaled for the data points shown (see screenshot). My expectation would be that the X-Axis is limited to something like minimum timestamp in the data query to maximum timestamp in the query (and the window moves with the data). How can I achieve this?

I tried using the 'XAxisMinimumValues' and 'XAxisMaximumValues' parameter of the line chart but it does not seem to work at all. If I put a time stamp there (e.g. Minimum is 20 minutes before 'now' and maximum is 'now'), it shows the same range of the X-Axis as on the screenshot. Any idea why these parameters do not work?
Help is very appreciated, in case you need more info feel free to ask.
Regards,
Kevin
Solved! Go to Solution.
Labels:
- Labels:
-
Mashup-Widget
-
Troubleshooting
ACCEPTED SOLUTION
Accepted Solutions
Nov 11, 2020
10:04 AM
- Mark as New
- Bookmark
- Subscribe
- Mute
- Subscribe to RSS Feed
- Permalink
- Notify Moderator
Please log in to access translation
Nov 11, 2020
10:04 AM
Hello @kevinb_kad,
It seems that QueryPropertyHistory is invoked on the value stream with the maxItems set to a specific value.
If we have an example with 3 properties having 3 separate entries, then the total number of data points would be 9.
QueryPropertyHistory queried each individual property three times because the maxItems was set to three.
Since there were three data entries for each property, the maximum amount of Items returned was possible: nine rows.
Hope it helps,
3 REPLIES 3
Nov 10, 2020
04:40 AM
- Mark as New
- Bookmark
- Subscribe
- Mute
- Subscribe to RSS Feed
- Permalink
- Notify Moderator
Please log in to access translation
Nov 10, 2020
04:40 AM
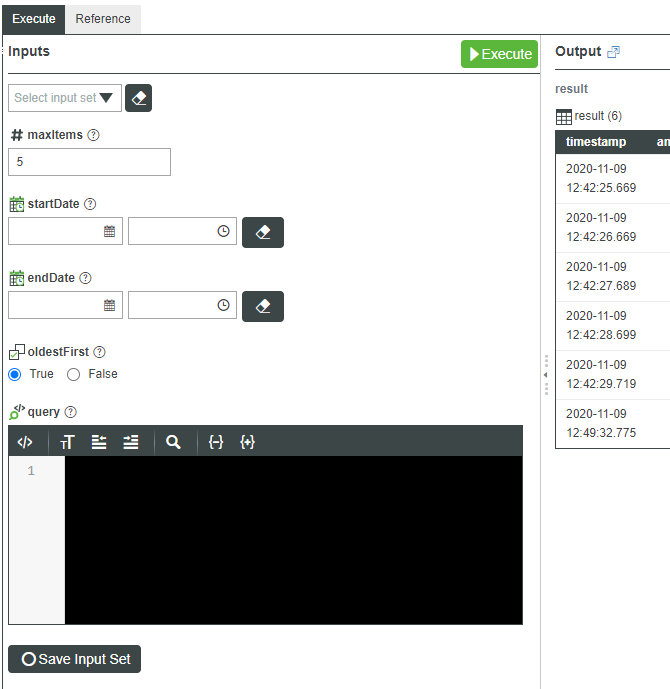
Addition: I think I could already narrow down one part of the problem. If I execute the queryPropertyHistory in a minimum example I noticed some strange things (see screenshot). If I query 5 maxItems in either direction (oldestFirst true or false), I
- get more than 5 rows (6 with oldestFirst=true, 8 otherwise)
- get the first 5 results from either the oldest or newest data point but also get one row with a much older data point (if I start with the newest). This seems to be the left end of the X-Axis in the chart. Why is this included in the query result?
Nov 11, 2020
10:04 AM
- Mark as New
- Bookmark
- Subscribe
- Mute
- Subscribe to RSS Feed
- Permalink
- Notify Moderator
Please log in to access translation
Nov 11, 2020
10:04 AM
Hello @kevinb_kad,
It seems that QueryPropertyHistory is invoked on the value stream with the maxItems set to a specific value.
If we have an example with 3 properties having 3 separate entries, then the total number of data points would be 9.
QueryPropertyHistory queried each individual property three times because the maxItems was set to three.
Since there were three data entries for each property, the maximum amount of Items returned was possible: nine rows.
Hope it helps,
Nov 13, 2020
03:27 AM
- Mark as New
- Bookmark
- Subscribe
- Mute
- Subscribe to RSS Feed
- Permalink
- Notify Moderator
Please log in to access translation
Nov 13, 2020
03:27 AM
Dear @Ciprian-Traian ,
thank you for your answer. I guess I just had a different understanding of what maxItems would do in querypropertyhistory. With your explanation it makes sense, I will now use a different service to retrieve exactly what I need.
Can be closed.


