- Community
- ThingWorx
- ThingWorx Developers
- Re: Manage a stream
- Subscribe to RSS Feed
- Mark Topic as New
- Mark Topic as Read
- Float this Topic for Current User
- Bookmark
- Subscribe
- Mute
- Printer Friendly Page
Manage a stream
- Mark as New
- Bookmark
- Subscribe
- Mute
- Subscribe to RSS Feed
- Permalink
- Notify Moderator
Manage a stream
Hi everybody.
I am gathering temperatures from sensors in a Stream.
I would like to display a chart showing the evolution of temperature for a selected sensor.
The time series chart i am currently using does not make a distinction between the two sensors i have. So basically, my curve is garbage.
I have two questions :
1) How could i produce a chart depending on the sensor i choose in a grid with the list of my sensors ?
2) Is there a way to sort the datas gathered in my stream to make one curve for each sensor ?
Thank you in advance.
- Labels:
-
Troubleshooting
- Mark as New
- Bookmark
- Subscribe
- Mute
- Subscribe to RSS Feed
- Permalink
- Notify Moderator
the Thingworx Fundamentals covers this.
First either by logging or using a subscription store your data in either a ValueStream or Stream
Get a list of your Sensors - Use a service that wraps something like GetImplementingThings of your ThingTemplate
Use Selected row values to drive the next service based on the dynamic Thingtemplate service to retrieve your information. something like QueryPropertyHistory or QueryStreamEntriesWithData (use a wrapped service for QueryStream entries)
Add data to chart define X/Y
for #2 you can use services to combine data into one infotable so you can have multiple series in one chart.
Again I recommend taking Thingworx Fundamentals if you haven't yet.
- Mark as New
- Bookmark
- Subscribe
- Mute
- Subscribe to RSS Feed
- Permalink
- Notify Moderator
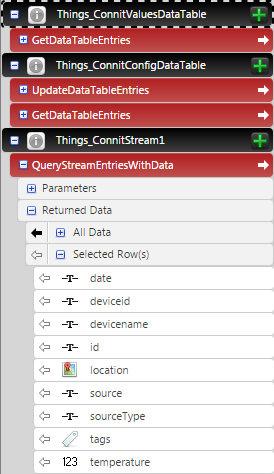
Here is a view of the services i call :

As ou can see, i already made a stream where all my information is stored.
The field "deviceid" refers to the name of the different sensors.
Now, i would like to do two things :
1) First, make a chart where all the curves can be displayed at the same time
2) Then, select a sensor from the list created with the service "Get data table entries" to display the corresponding measurement points from this specific sensor
I could not find the service to combine the datas into one infotable. Could you try to help me please ?
- Mark as New
- Bookmark
- Subscribe
- Mute
- Subscribe to RSS Feed
- Permalink
- Notify Moderator
QueryStreamEntries with data takes a parameter called Source to determine which Thing to return data for. So to use that your will need multiple instances of the service and you'll have to bind the output of each to separate DataSource targets on your TimeSeries Chart (there are 16 of these available). There is a Query Parameter you can try and use but I'm not sure you'll be able to accurately limit the set of Things it returns as the comparator is limited to:
- Starts With
- Contains
- Ends With
- Is Exactly
If you don't want to do this, you'll need to write your own service that creates an InfoTable from the results of separate QueryStreamEntriesWithData calls. So for each TimeStamp value you'll have a column for each Thing's sensor value at that time. The challenge here is that it's unlikely that the data for a collection of things will share the same timestamp so your graph may get a bit messy.
Regards
Ian
- Mark as New
- Bookmark
- Subscribe
- Mute
- Subscribe to RSS Feed
- Permalink
- Notify Moderator
Thanks for your answer.
Actually, the first solution you are explaining is interesting for small amounts of sensors.
Unfortunately, i would like to expand the number of sensors i am currently using so i cannot go for the first solution.
I agree with you on the fact that my graph could get messy with timestamps from different sensors.
To address the issue, i imagined creating a list of my devices with the stream of data. I could choose on of my device and change the datas provided to the time chart accordingly.
Do you know the name of the services that could help me do that ?
Thanks again for your help.


