
Turn on suggestions
Auto-suggest helps you quickly narrow down your search results by suggesting possible matches as you type.
Showing results for
Please log in to access translation
Turn on suggestions
Auto-suggest helps you quickly narrow down your search results by suggesting possible matches as you type.
Showing results for
- Community
- ThingWorx
- ThingWorx Developers
- Re: Proportional Chart extra padding
Translate the entire conversation x
Please log in to access translation
Options
- Subscribe to RSS Feed
- Mark Topic as New
- Mark Topic as Read
- Float this Topic for Current User
- Bookmark
- Subscribe
- Mute
- Printer Friendly Page
Proportional Chart extra padding
May 21, 2020
03:03 PM
- Mark as New
- Bookmark
- Subscribe
- Mute
- Subscribe to RSS Feed
- Permalink
- Notify Moderator
Please log in to access translation
May 21, 2020
03:03 PM
Proportional Chart extra padding
Hello,
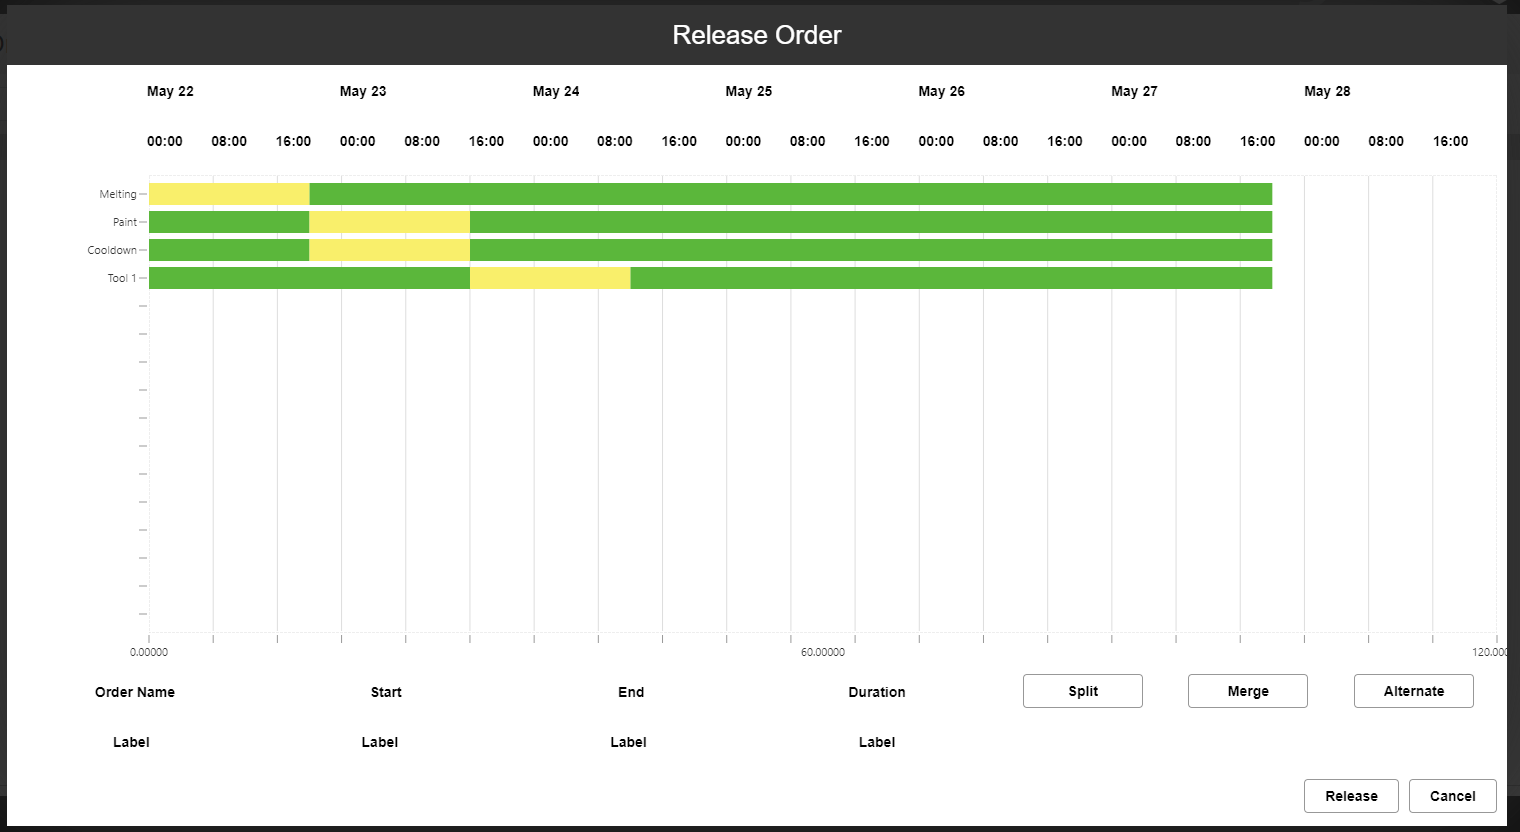
I am having an issue with the proportional chart, I am using it horizontally and set the chart max to be 100. All of my data sets go from 0 to 100 yet the grid shows up to 120 and the bars do not fill the entire chart. I have tried increasing my data set to go from 0 to 120 but the grid just shows 140. Has anyone run into this issue and found a resolution?
Solved! Go to Solution.
Labels:
- Labels:
-
Mashup-Widget
ACCEPTED SOLUTION
Accepted Solutions
May 22, 2020
08:22 AM
- Mark as New
- Bookmark
- Subscribe
- Mute
- Subscribe to RSS Feed
- Permalink
- Notify Moderator
Please log in to access translation
May 22, 2020
08:22 AM
It seems as though the chart adds some extra space when the data is exactly the maximum. I was able to get it to be close by setting the y axis max to 100,000 and having my dataset go up to 99999.
1 REPLY 1
May 22, 2020
08:22 AM
- Mark as New
- Bookmark
- Subscribe
- Mute
- Subscribe to RSS Feed
- Permalink
- Notify Moderator
Please log in to access translation
May 22, 2020
08:22 AM
It seems as though the chart adds some extra space when the data is exactly the maximum. I was able to get it to be close by setting the y axis max to 100,000 and having my dataset go up to 99999.


