
Turn on suggestions
Auto-suggest helps you quickly narrow down your search results by suggesting possible matches as you type.
Showing results for
Please log in to access translation
Turn on suggestions
Auto-suggest helps you quickly narrow down your search results by suggesting possible matches as you type.
Showing results for
- Community
- ThingWorx
- ThingWorx Developers
- Re: Querying and rendering Thing Properties
Translate the entire conversation x
Please log in to access translation
Options
- Subscribe to RSS Feed
- Mark Topic as New
- Mark Topic as Read
- Float this Topic for Current User
- Bookmark
- Subscribe
- Mute
- Printer Friendly Page
Querying and rendering Thing Properties
Aug 11, 2020
10:26 AM
- Mark as New
- Bookmark
- Subscribe
- Mute
- Subscribe to RSS Feed
- Permalink
- Notify Moderator
Please log in to access translation
Aug 11, 2020
10:26 AM
Querying and rendering Thing Properties
Hi Folks,
I have a large data set of Thing Properties about (1000 Things * 20 properties) to render on Charts. I have already tried below recommendations but still facing performance issues and even with test data of 700 records,its taking more than 20 seconds to render completely.
1. Already using NamedPropertyHistory for specific props only.
2. Data is being filtered with start/end date params already
Any suggestions to improve the performance and loading time?
Labels:
- Labels:
-
Best Practices
-
Coding
10 REPLIES 10
Aug 11, 2020
01:51 PM
- Mark as New
- Bookmark
- Subscribe
- Mute
- Subscribe to RSS Feed
- Permalink
- Notify Moderator
Please log in to access translation
Aug 11, 2020
01:51 PM
Hi there,
A couple of details we need to be able to provide any advice.
1. The structure of the mashup where you can see the slow rendering . Eg: "I have 3 timeseries v2 charts, each displaying x amount of values - we need this x. The mashup is specific for a single Thing" . From your description I would be tempted to say that you're trying to display all the 1000 things at once with all their properties in a single chart, which would be really slow, so therefore I need to validate this assumption.
2. You're using logged properties, right? If so, what type of datachange you've setup for your logged properties: ALWAYS or VALUE?
3. This slowness is being shown for a single user or when doing performance tests for multiple users?
4. What kind of instance are you using? Is it a Postgres, H2 and additionally, is it cloud-hosted or installed in your machine?
5. Give us an idea of the response time that is seen in the browser when consuming the slow mashup. Use the Developer tools and tell us the response size for that Service request that feeds the Chart/s. Supplimentary, look at the timings and see how much time is being spent: a. for waiting (this means the time the server spends for doing the actual search) and b. for receiving
Would that be doable?
- Tags:
- i th
Aug 12, 2020
05:45 AM
- Mark as New
- Bookmark
- Subscribe
- Mute
- Subscribe to RSS Feed
- Permalink
- Notify Moderator
Please log in to access translation
Aug 12, 2020
05:45 AM
Hi Vladimir,
First of all,there's a correction.
I am rendering data as: 1 Thing * 20 properties*updates every 10 minutes on a Label chart. And want to display for different date range like last 7 days,30 days,45 days,etc.
1. Mashup Structure- Its pretty simple bind of QueryNamedProperties service to "All Data" with required start/end date.
2.Properties logged-Yes, required properties are logged to "ALWAYS".
3. Slowness is being shown-It is being tested by 2-3 folks for now. But going to be used by more than that.
4. Its a Postgres instance and hosted in a Cloud VM.
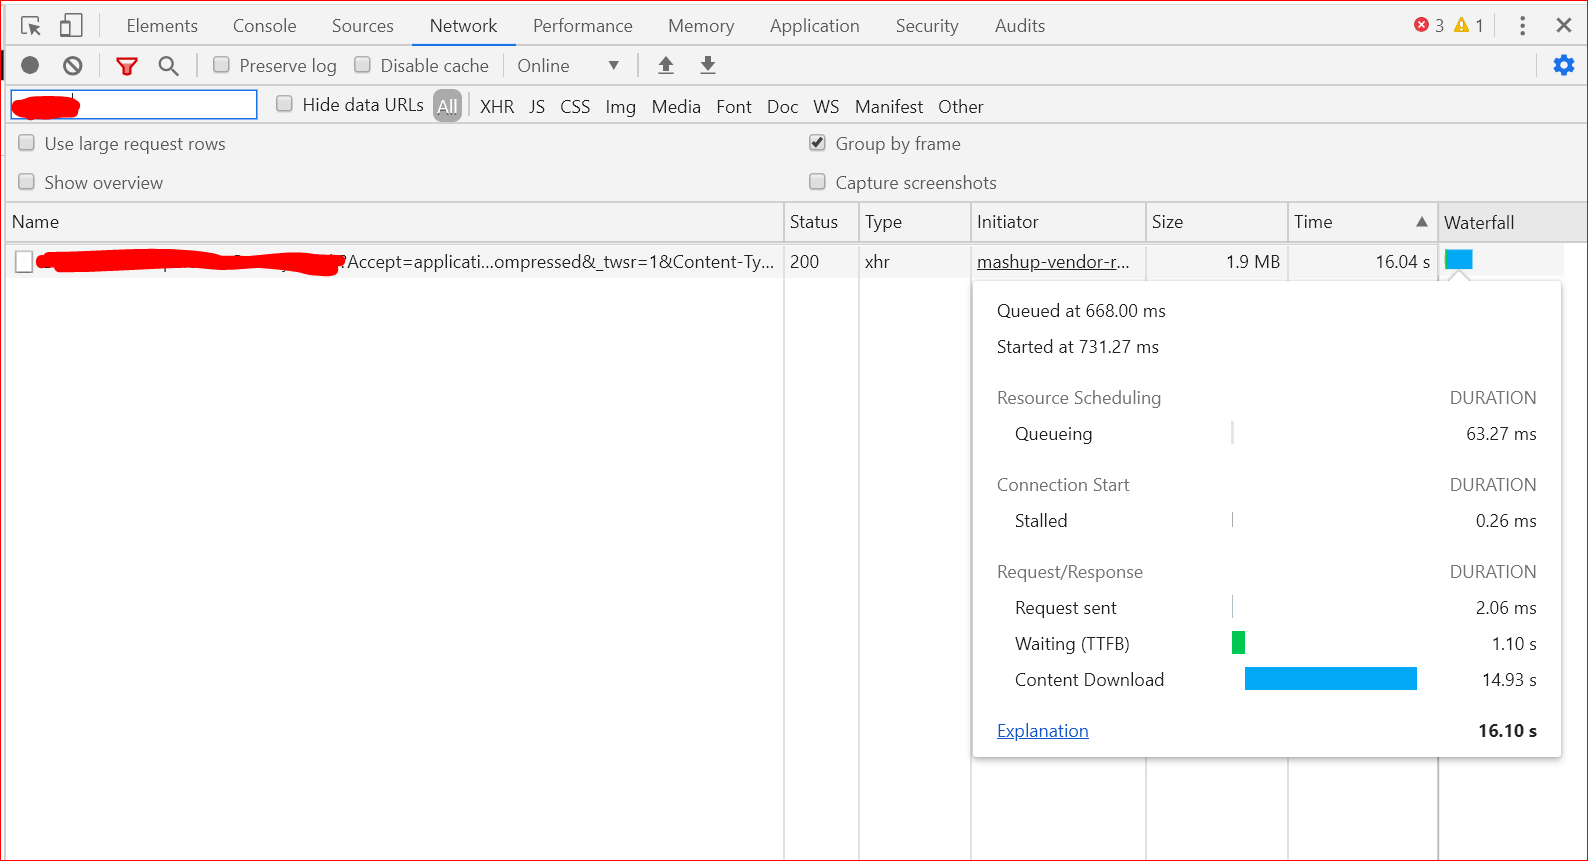
5. Please find the attached snapshot for request-response time details. This request is for last 8 days only.
Aug 12, 2020
02:48 PM
- Mark as New
- Bookmark
- Subscribe
- Mute
- Subscribe to RSS Feed
- Permalink
- Notify Moderator
Please log in to access translation
Aug 12, 2020
02:48 PM
I'm reusing your answer to comment line by line, but if you want to go to the interesting part, look at point 5:
--------------------------------------------------------------------------------------------------------
Hi Vladimir,
First of all,there's a correction.
I am rendering data as: 1 Thing * 20 properties*updates every 10 minutes on a Label chart. And want to display for different date range like last 7 days,30 days,45 days,etc.
Vlad's comment: this won't work in a scalable manner. If your machines output data continously, the amount of rows will become too high to be displayed in a chart (1 day = 144 rows, 7 days = 1008 rows, 30 days = 4320 rows - the large timespans will become an issue).
Note:
Are you sure the Label chart is a good fit for this usecase? I would use the Timeseries instead, if you need historical values as a graph- which seems to be implied. Also, can you post a quick screenshot of how the chart would look now?
1. Mashup Structure- Its pretty simple bind of QueryNamedProperties service to "All Data" with required start/end date.
2.Properties logged-Yes, required properties are logged to "ALWAYS".
Vlad's comment: Out of reflex I usually strongly recommend against having properties set as ALWAYS, simply because they consume a lot of DB space, especially in highly chatty usecases. In your case however, the update rate is not that high - but keep in mind and potentially be prepared to switch to "VALUE". You'll have the "why I don't have data for this property in this range?" symptom, but that can be fixed via code (create a wrapper service that goes back in the history and stream and adds manually that single entry to your infotable row).
3. Slowness is being shown-It is being tested by 2-3 folks for now. But going to be used by more than that.
4. Its a Postgres instance and hosted in a Cloud VM.
5. Please find the attached snapshot for request-response time details. This request is for last 8 days only.
Vlad's comment: that's the main clue. The content-download time is extremely high for just 1.9MB
In light of these findings I suggest the following:
-use your favorite REST client (Postman, Soap UI etc) and replicate the REST call you showed us in the Developer Tools. Execute this call from the same computer as the one you experience the slowness.
I believe (but I'm not 100% sure) that you should see the same response time as the one from the browser, which would lead me to the conclusion that there's something (proxy, firewall, ISP internet speed) that slows down the download of that HTTP response. Obviously, in such cases if your policies allow it, you can test this behavior from another computer and network (by using the REST call you created above or accessing the mashup) and see if the content download time is the same.
Aug 12, 2020
02:58 PM
- Mark as New
- Bookmark
- Subscribe
- Mute
- Subscribe to RSS Feed
- Permalink
- Notify Moderator
Please log in to access translation
Aug 12, 2020
02:58 PM
Hi Vladimir,
I can't use Timeseries chart since it has a limit of series and I have 20 series to display.Hence used Label chart.
I can change Property Logged to "Value" but that will help me saving DB issues in long run.
Regarding 5th point. Network latency or internet speed is definitely not an issue.
Aug 12, 2020
03:12 PM
- Mark as New
- Bookmark
- Subscribe
- Mute
- Subscribe to RSS Feed
- Permalink
- Notify Moderator
Please log in to access translation
Aug 12, 2020
03:12 PM
For point 5, maybe, but the content download time does say 14.9 seconds and the server finished the service in ~1 second. The REST call suggestion is made to rule out any rendering impact on that time - even if based on my knowledge it should not happen.
Aug 12, 2020
03:30 PM
- Mark as New
- Bookmark
- Subscribe
- Mute
- Subscribe to RSS Feed
- Permalink
- Notify Moderator
Please log in to access translation
Aug 12, 2020
03:30 PM
I have many media entities being loaded before the actual data service. Is there any workaround to cache or bypass them so that the main data service get loaded faster?
And ,what's is expected time(seconds) for a chart to load 1000 records?
Aug 12, 2020
03:39 PM
- Mark as New
- Bookmark
- Subscribe
- Mute
- Subscribe to RSS Feed
- Permalink
- Notify Moderator
Please log in to access translation
Aug 12, 2020
03:39 PM
I suggest performing that test I spoke about, even if you're 100% sure that internet speed is not the issue.
You should open, in parallel to this thread, a Tech Support ticket, presuming you have an active subscription.
In the forum I'm active only from time to time, and I'm not part of our Technical Support unit
Aug 14, 2020
01:52 AM
- Mark as New
- Bookmark
- Subscribe
- Mute
- Subscribe to RSS Feed
- Permalink
- Notify Moderator
Please log in to access translation
Aug 14, 2020
01:52 AM
I have many media entities being loaded before the actual data service. Is there any workaround to cache or bypass them so that the main data service get loaded faster?
And ,what's is expected time(seconds) for a chart to load 1000 records?
Sep 23, 2020
03:35 PM
- Mark as New
- Bookmark
- Subscribe
- Mute
- Subscribe to RSS Feed
- Permalink
- Notify Moderator
Please log in to access translation
Sep 23, 2020
03:35 PM
If the media entries, there is an option to increase the cache available in Tomcat. This generally works for static files (and you may be able to serve some of these files as static images rather than as media files:
(OPTIONAL STEP) To increase the default cache settings that affect static file caching, add the following line within the <context></context> tags in the /conf/context.xml file:
<Resources cacheMaxSize="501200" cacheObjectMaxSize="2048" cacheTtl="60000"/>
If you are able to capture and attach a .har file of the mashup execution we may be able to assist with potentially optimizing some of the background services or the current bottlenecks:
Aug 12, 2020
02:58 PM
- Mark as New
- Bookmark
- Subscribe
- Mute
- Subscribe to RSS Feed
- Permalink
- Notify Moderator
Please log in to access translation
Aug 12, 2020
02:58 PM


