- Community
- ThingWorx
- ThingWorx Developers
- SQL Data to Properties for Time Series chart or pl...
- Subscribe to RSS Feed
- Mark Topic as New
- Mark Topic as Read
- Float this Topic for Current User
- Bookmark
- Subscribe
- Mute
- Printer Friendly Page
SQL Data to Properties for Time Series chart or plotting directly from a SQL query
- Mark as New
- Bookmark
- Subscribe
- Mute
- Subscribe to RSS Feed
- Permalink
- Notify Moderator
SQL Data to Properties for Time Series chart or plotting directly from a SQL query
Hi,
I have a database table were I keep the values of several parameters from aa machine on the shopfloor: temperature, current, quench flow, cycle time, etc. and a timestamp. Something like this:
| id | timestamp | temperature | current | quenchflow | cycletime |
|---|---|---|---|---|---|
| 1 | value | value | value | value | value |
| 2 | value | value | value | value | value |
I have a simple SQL query service that return the data in an Infotable with a simple SELECT statement. And, if I send this result directly to a Time Series chart (I use the timestamp column for the X axis) I can plot the data for all the variables in the same graph.
This is OK as test, but I´m wondering if I there is an option to provide a way to select just one of the columns from the SQL query, perhaps in a list and then use this to feed the Time Series chart and show only the data for that field.
I can iterate the Infotable, assign the values to the properties of a ThingHelper, mark this properties as logged to a Value Stream and after that I can use a QueryPropertyHistory service to get the data and plot to the TimeSeries chart. But I don't like this approach because it creates a copy of the data in Thingworx.
Anyone has ever tried this? O if you can give me some directions or examples I would really appreciate it.
Thans
- Labels:
-
Coding
- Mark as New
- Bookmark
- Subscribe
- Mute
- Subscribe to RSS Feed
- Permalink
- Notify Moderator
Hi Omar, sorry i'm not completely clear of your statement that "This is OK as test, but I´m wondering if I there is an option to provide a way to select just one of the columns from the SQL query, "
Do you mean to select 1 column's output from the your select statement? May be with some database's materialised views you can completely restrict pulling of data from the Database which you don't intend to use in ThingWorx. Reason why i mentioned Views contrary to simply doing select on individual columns is for the performance, as these are precomputed in database. This way you will only get the data that you intend to use in your graph and you can use several of those views wrapped within a JS service
pseudo code for it could be something
if (option == 1){
me.CallToMaterializedView1SQLService;
} else if (option == 2) {
me.CallToMaterializedView2SQLService;
} else {
me.CallToMaterializedView3SQLService;
}
Feel free to correct me if you think this isn't what you are looking for.
- Mark as New
- Bookmark
- Subscribe
- Mute
- Subscribe to RSS Feed
- Permalink
- Notify Moderator
Hello Omar,
I don't know if I get it right. But you can do two aproaches:
- SELECT just the columns you want by the SQL Query in your service.
Or
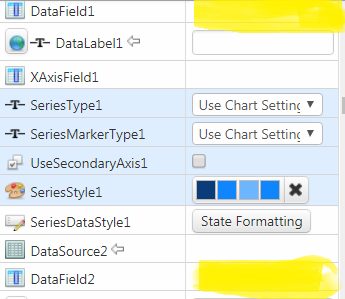
- In the widget configuration, you can select the data to shown, select one or more columns of your infotable to be show in the Times Series Chart.

- Mark as New
- Bookmark
- Subscribe
- Mute
- Subscribe to RSS Feed
- Permalink
- Notify Moderator
Hi,
Thanks to all for your feedback.
What I was trying to do was to feed the Time Series Chart with the result from a SQL query to plot the data. At first I was retrieveing all the data columns in a single query, but since there are diferences between the value ranges of the variables the chart looks awkward also the number of variables to plot is greater than the 8 time series that this widget support.
At the end I created a SQL service that takes the variable/property name as a a parameter to retrieve only the data for that column from the database and pass the result to the chart, that way the service is dynamic and I´m only using one chart to plot all the variables.
I'll try a solution similar to what Sushant Pandey proposes (there is no materialized views on MySQL/MSSQL) in the meantine I think that I'm OK with the result so I'm going to close this thread.
Again thank you for all you suppport


