
Turn on suggestions
Auto-suggest helps you quickly narrow down your search results by suggesting possible matches as you type.
Showing results for
Please log in to access translation
Turn on suggestions
Auto-suggest helps you quickly narrow down your search results by suggesting possible matches as you type.
Showing results for
- Community
- ThingWorx
- ThingWorx Developers
- Re: Second Y-Axis Line Chart Widget, Number of Ser...
Translate the entire conversation x
Please log in to access translation
Options
- Subscribe to RSS Feed
- Mark Topic as New
- Mark Topic as Read
- Float this Topic for Current User
- Bookmark
- Subscribe
- Mute
- Printer Friendly Page
Second Y-Axis Line Chart Widget, Number of Series is Dynamic
Jul 01, 2025
10:25 AM
- Mark as New
- Bookmark
- Subscribe
- Mute
- Subscribe to RSS Feed
- Permalink
- Notify Moderator
Please log in to access translation
Jul 01, 2025
10:25 AM
Second Y-Axis Line Chart Widget, Number of Series is Dynamic
Hi all,
I am trying to use the second Y-axis functionality on the line widget. The issue I am encountering is the properties displayed on the line chart are dynamically chosen by the user and input into the Data part of the info table, so it is unknown which Y-axis should be used for which property, but sometimes the property values history are very different numbers and could use an automated second Y-axis to make the data look good. Is there any way to do this really with this much uncertainty? I notice if there is a set number of Series that they can be set to either axis 1 or axis 2, but in this case, I don't have a set number of series so cannot really choose and they could need different scales but might not.
Any input is appreciated!
Version 9.7.1
Solved! Go to Solution.
Labels:
- Labels:
-
Mashup-Widget
-
Troubleshooting
ACCEPTED SOLUTION
Accepted Solutions
Jul 15, 2025
11:37 AM
- Mark as New
- Bookmark
- Subscribe
- Mute
- Subscribe to RSS Feed
- Permalink
- Notify Moderator
Please log in to access translation
Jul 15, 2025
11:37 AM
@JK_10744682 ,
I was heading down the wrong widget. You are using the Combo Widget.
I believe you are trying to get something that looks like: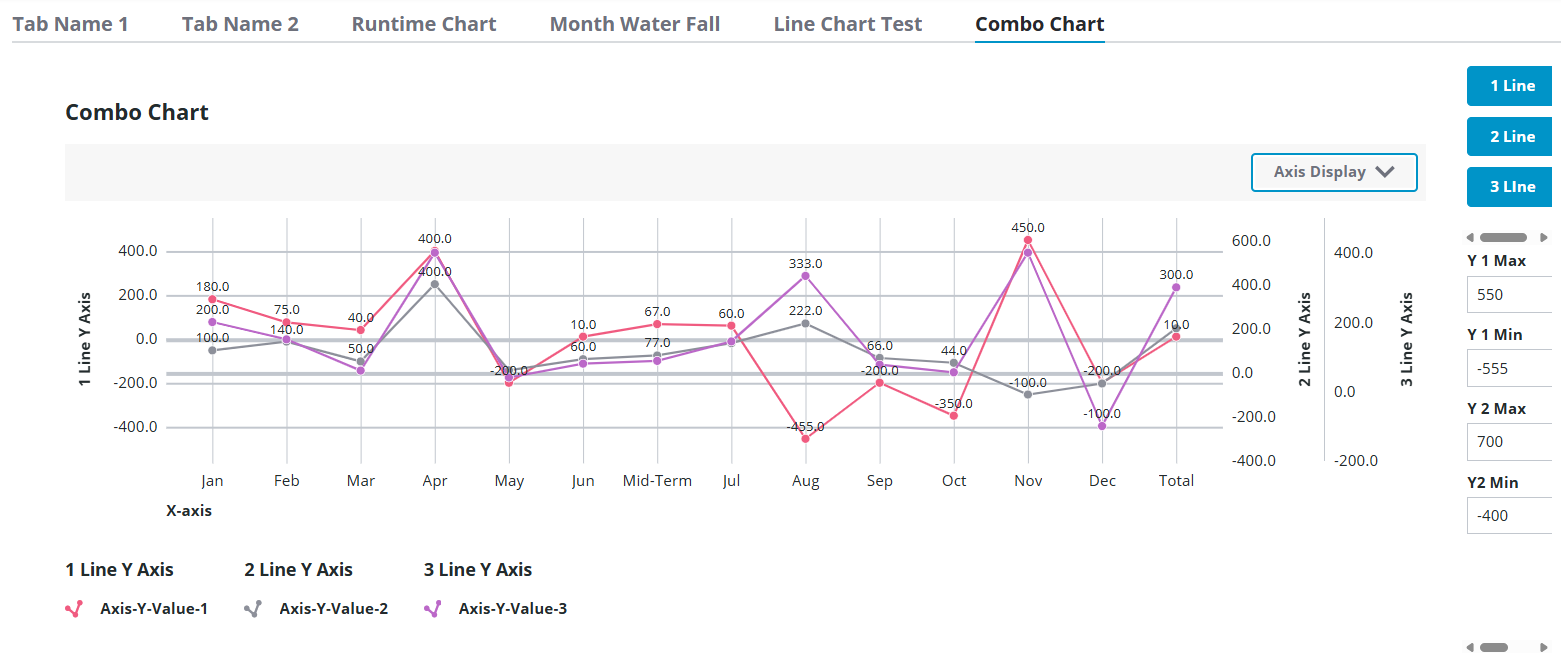
There were a few things which needed to be set to get multiple axis.
I have set:
NumberOfSeries
ShowYAxis
NumberOfYAxis
You should then find properties of "YAxis1Max...", YAxis1Min...", YAxis1Num..."
Because of how Composer works. After setting some of the properties you will not find fields you expect. What is required is to save the Mashup and force the Browser to reload the display. The dynamic fields should then be reconfigured.
5 REPLIES 5
Jul 07, 2025
08:17 AM
- Mark as New
- Bookmark
- Subscribe
- Mute
- Subscribe to RSS Feed
- Permalink
- Notify Moderator
Please log in to access translation
Jul 07, 2025
08:17 AM
Hello @JK_10744682 ,
I believe that your request to have dynamic number of serries is not supported. I am checking with a subject matter expert to see if this is on the development plan.
Regards,
Pehowe
Jul 10, 2025
03:13 PM
- Mark as New
- Bookmark
- Subscribe
- Mute
- Subscribe to RSS Feed
- Permalink
- Notify Moderator
Please log in to access translation
Jul 10, 2025
03:13 PM
Hello @JK_10744682 ,
I took a look at the issue and reviewed with a Subject Matter Expert.
If you leave the Waterfall Widget properties NumberOfSeries as Auto, the number of lines on the chart is driven by the infotable which is provided to the chart. I believe that the Widget support from 1 to 24 lines.
In my testing I used a data shape which had data columns for 5 lines. When there was no data for lines 2-5, I assigned the values in the info table to "undefined".
When the chart is displayed I only see the lines which have data. I was able to switch between 1, 2, or 3 lines on the chart.
Does this meet your needs?
If it is helpful I can share my test case.
Regards,
Peter
Jul 11, 2025
08:34 AM
- Mark as New
- Bookmark
- Subscribe
- Mute
- Subscribe to RSS Feed
- Permalink
- Notify Moderator
Please log in to access translation
Jul 11, 2025
08:34 AM
Based on your message, it seems that would solve setting the number of series, but wouldn't help with my real issue of setting each of those to a second Y-Axis if the data is far apart between each series. This DisplaySeries1On property is not bindable so even if I was able to dynamically choose which axis each series should be on and what each axis should be I couldn't since this isn't bindable. Maybe I am not fully understanding and your use case can resolve this.

Jul 15, 2025
11:37 AM
- Mark as New
- Bookmark
- Subscribe
- Mute
- Subscribe to RSS Feed
- Permalink
- Notify Moderator
Please log in to access translation
Jul 15, 2025
11:37 AM
@JK_10744682 ,
I was heading down the wrong widget. You are using the Combo Widget.
I believe you are trying to get something that looks like:
There were a few things which needed to be set to get multiple axis.
I have set:
NumberOfSeries
ShowYAxis
NumberOfYAxis
You should then find properties of "YAxis1Max...", YAxis1Min...", YAxis1Num..."
Because of how Composer works. After setting some of the properties you will not find fields you expect. What is required is to save the Mashup and force the Browser to reload the display. The dynamic fields should then be reconfigured.
Jul 15, 2025
11:37 AM
- Mark as New
- Bookmark
- Subscribe
- Mute
- Subscribe to RSS Feed
- Permalink
- Notify Moderator
Please log in to access translation
Jul 15, 2025
11:37 AM
@JK_10744682 , Let me know if you have questions?
I can also share my project if you are interested.
Regards,
Pehowe


