- Community
- ThingWorx
- ThingWorx Developers
- Re: Thingworx Server does not respond to connectio...
- Subscribe to RSS Feed
- Mark Topic as New
- Mark Topic as Read
- Float this Topic for Current User
- Bookmark
- Subscribe
- Mute
- Printer Friendly Page
Thingworx Server does not respond to connections from edge SDK
- Mark as New
- Bookmark
- Subscribe
- Mute
- Subscribe to RSS Feed
- Permalink
- Notify Moderator
Thingworx Server does not respond to connections from edge SDK
Hello,
I have been playing around with the edge SDK and I have encountered a problem. I have been able to authenticate, bind, connect, and see the values updating. However, I am experiencing a problem running any of the Java SDK applications for longer than 7 minutes.
The first time I run the application, it runs fine. If I stop it and run it again, it runs fine. If I run it for a few minutes, it runs fine.
However, if I run it for longer than about 7 minutes, the server starts refusing connections. Even if I wait for days, it does not work. It only starts functioning again once I restart the tomcat service. The thing does show up as connected, but then promptly disconnects without any data having been transmitted.
I am almost 100% certain this is a config issue with tomcat, rather than a code issue, because the examples exhibit the same problems.
The server is an instance of ThingWorx on a computer in the local network (not localhost) and I have uninterrupted access between it and the application via wired connection.
I have attached an excerpt from the console, if you do a quick search for "unable" you will see that at 16:53:13, the server stopped responding.
- Labels:
-
Connectivity
-
Install-Upgrade
- Mark as New
- Bookmark
- Subscribe
- Mute
- Subscribe to RSS Feed
- Permalink
- Notify Moderator
I have been trying random things playing around and it seems that when I restart the web socket execution processing subsystem, it starts working again.
I have gone deeper into the logs and this issue seems to be related to the VM running out of memory. Whenever I try to import a file now, I get the error "Unable to create new native thread". There is no reason why the program would run out of resources, seeing it is running on 8GB RAM and properties are being pushed only once a second.
So I restarted the WebSocket services once more and started looking at the logs at the "ALL" level.
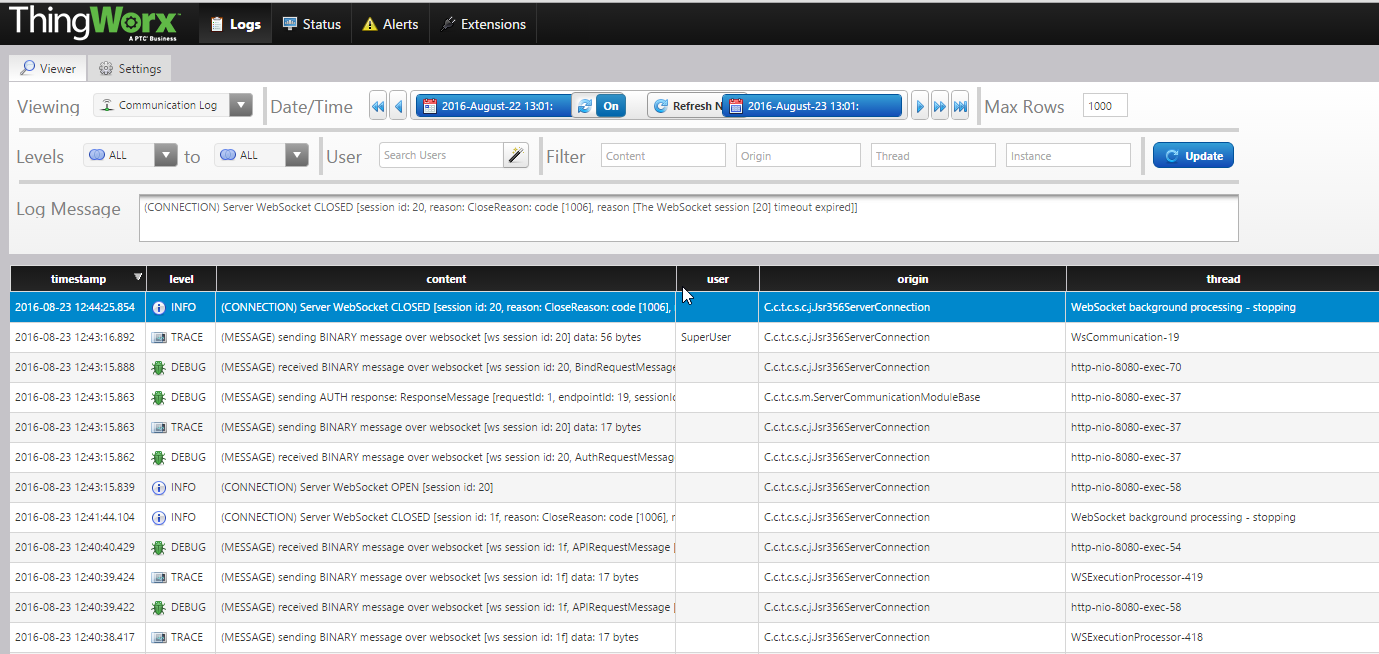
I noticed that the Thread for each (MESSAGE) sending BINARY message over websocket does not get reused. At least it seems so, because I can see the same http-nio-8080-exec-<xx> appearing several times. However, I can never see the same WSExecutionProcessor-419.

So I did a Java Thread Dump and this is at the top of the dump:
"WSExecutionProcessor-419" #2176 daemon prio=5 os_prio=0 tid=0x00007f83308bf800 nid=0x2289 waiting on condition [0x00007f82d8c58000]
java.lang.Thread.State: TIMED_WAITING (parking)
at sun.misc.Unsafe.park(Native Method)
- parking to wait for <0x00000000f6704960> (a com.thingworx.common.utils.ApproximatelyBoundedLinkedTransferQueue)
at java.util.concurrent.locks.LockSupport.parkNanos(LockSupport.java:215)
at java.util.concurrent.LinkedTransferQueue.awaitMatch(LinkedTransferQueue.java:734)
at java.util.concurrent.LinkedTransferQueue.xfer(LinkedTransferQueue.java:647)
at java.util.concurrent.LinkedTransferQueue.poll(LinkedTransferQueue.java:1277)
at com.thingworx.common.utils.ApproximatelyBoundedLinkedTransferQueue.poll(ApproximatelyBoundedLinkedTransferQueue.java:77)
at java.util.concurrent.ThreadPoolExecutor.getTask(ThreadPoolExecutor.java:1066)
at java.util.concurrent.ThreadPoolExecutor.runWorker(ThreadPoolExecutor.java:1127)
at java.util.concurrent.ThreadPoolExecutor$Worker.run(ThreadPoolExecutor.java:617)
at java.lang.Thread.run(Thread.java:745)
My question is: how do I fix this? I am assuming there could be two culprits:
1. TWX Developer has been improperly configured
2. My code is weird.
Given that I have followed the installation manuals from the website, I doubt that my config is wrong.
It is possible that I have messed up my Java SDK code.
My java code on the Thing side is a variation of the TemperatureThing from the academic program. It calls
updateSubscribedProperties(2000);
to update the properties, and as far as I know, this is the only code needed to handle this process.
- Mark as New
- Bookmark
- Subscribe
- Mute
- Subscribe to RSS Feed
- Permalink
- Notify Moderator
Ok, I have restarted the WS Execution Processing Subsystem, it deleted all the Java threads that were stuck in the "waiting" state and my SDK will work again, until it runs out of threads (again).
Since the WSExecutionProcessors are not recreated upon restart of the service, I can only assume that these threads are not part of a pool of reusable threads. I am now trying to find out if this is normal behaviour of the platform or a problem with my particular setup.
Can anyone please check if in their communication logs, WSExecutionProcessors threads are reused and whether they persist after the client connection has been closed? The level of the messages connected to these threads is TRACE and they are located in the Communication logs.
You can take a java thread dump (list of all java threads) in (Ubuntu/Linux) by:
1. Find out which process is tomcat java running under:
ps -aef | grep java
This will filter out and highlight the java processes, most notably the tomcat process.
2. Take a thread dump by typing in:
sudo kill -3 <ID OF THE PROCESS YOU WANT TO TAKE THREAD DUMP FOR>
3. Examine the end of the <TOMCAT_HOME>/logs/catalina.out - this will list all of the processes. You can find the beginning of your thread dump by searching for "Full thread dump"
- Mark as New
- Bookmark
- Subscribe
- Mute
- Subscribe to RSS Feed
- Permalink
- Notify Moderator
Kaloyan, regarding the out of memory question, how much memory (both xmx and xms) have you allocated to the java process (in Configure Tomcat -> Java tab)?
- Mark as New
- Bookmark
- Subscribe
- Mute
- Subscribe to RSS Feed
- Permalink
- Notify Moderator
Aanjan, I only have command-line access to the environment, so this is the output from the manager. The CATALINA_OPTS variable does not contain any settings for xmx and xms, so I guess these are the default settings:

- Mark as New
- Bookmark
- Subscribe
- Mute
- Subscribe to RSS Feed
- Permalink
- Notify Moderator
Any chance you would be able to get the xms and xmx values, along with the memory/ cpu usage after 7-ish minutes? How does the WS Execution Processing Subsystem look like?
- Mark as New
- Bookmark
- Subscribe
- Mute
- Subscribe to RSS Feed
- Permalink
- Notify Moderator
Hi Aanjan,
Somehow, it fixed itself. I have done the following:
1. Explicitly set the CATALINA_OPTS variable to include the following parameters through the "CATALINA_HOME/bin/setenv.sh" file:
export CATALINA_OPTS="$CATALINA_OPTS -Xms512m"
export CATALINA_OPTS="$CATALINA_OPTS -Xmx4096m"
export CATALINA_OPTS="$CATALINA_OPTS -XX:MaxPermSize=256m"
2. I ran the script by submitting a value every 0.25 seconds. This made it go through all 1000 threads in the WSExecution thread pool and restarted back at 1. Since then, I have not had the problem.
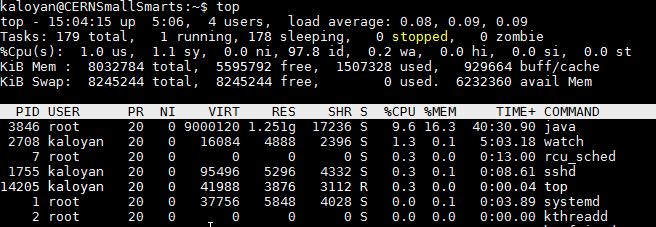
After the changes, the CPU usage is virtually unnoticeable, it is generally around 5%:

The Memory usage is a bit higher, but still reasonable at around 1.5 GB out of 8GB:

The JVM stats (after a few hours of running the update process at 0.25s)


