- Community
- ThingWorx
- ThingWorx Developers
- Re: Time series graph binding
- Subscribe to RSS Feed
- Mark Topic as New
- Mark Topic as Read
- Float this Topic for Current User
- Bookmark
- Subscribe
- Mute
- Printer Friendly Page
Time series graph binding
- Mark as New
- Bookmark
- Subscribe
- Mute
- Subscribe to RSS Feed
- Permalink
- Notify Moderator
Time series graph binding
Hi,
We have have data as below table
| Plant | Weight in tons | Time |
| P1 | 500 | 6/9/2017 |
| P2 | 600 | 6/10/2017 |
| P3 | 700 | 6/11/2017 |
| P4 | 800 | 6/12/2017 |
| P1 | 900 | 6/9/2017 |
| P2 | 1000 | 6/10/2017 |
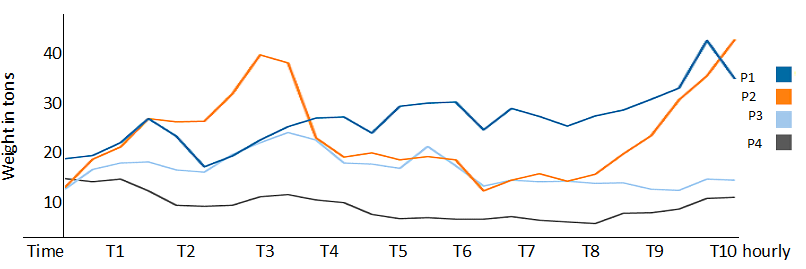
We what to bind the above data to graph as below, X-access time is fine when it comes to Y-access we are getting data for all in single column but we want to show different lines based on Plant type (P1,P2,P3 etc).

How can we achieve this please help us?
Regards,
Anil Kesana
- Mark as New
- Bookmark
- Subscribe
- Mute
- Subscribe to RSS Feed
- Permalink
- Notify Moderator
Hi Anil Kesana,
You are trying to create a Time Series Chart based on P1, P2, P3, P4. So, P1, P2, P3, P4 should be columns to show then in Time Series chart
The Data should be something below:
Time P1_Weight_in_tons P2_Weight_in_tons P3_Weight_in_tons P4_Weight_in_tons
6/09/2017 01:00 500
6/09/2017 02:00 900
6/10/2017 01:00 600
6/10/2017 02:00 1000
6/11/2017 01:00 700
6/12/2017 01:00 800
You might need to iterate through the Tables to make it like above.
- Mark as New
- Bookmark
- Subscribe
- Mute
- Subscribe to RSS Feed
- Permalink
- Notify Moderator
Hi Ankit,
Thanks for your quick response, I understood what your saying we need to write a service which takes current table iterate it and gives us output table as you mentioned. For these I believe need to use info tables in our service to achieve this . If you can send sample code how to iterate, It would be helpful us,meanwhile we are also exploring the same
Thanks in advance
Regards,
Anil Kesana
- Mark as New
- Bookmark
- Subscribe
- Mute
- Subscribe to RSS Feed
- Permalink
- Notify Moderator
Hi Ankit,
Do you have any code sinppets for this please send if you have any sample?
Regards,
Anil Kesana


