- Community
- ThingWorx
- ThingWorx Developers
- Use List widget as input Filter
- Subscribe to RSS Feed
- Mark Topic as New
- Mark Topic as Read
- Float this Topic for Current User
- Bookmark
- Subscribe
- Mute
- Printer Friendly Page
Use List widget as input Filter
- Mark as New
- Bookmark
- Subscribe
- Mute
- Subscribe to RSS Feed
- Permalink
- Notify Moderator
Use List widget as input Filter
Hi,
I want to create a MashUp 2 lists that acts as input for the final chart.
List 1 - List of Seasons
List 2 - List of Departments for the season selected in List 1.
Label Chart Showing appropriate data based on above 2 inputs.
I was able to implement above using Data Filter widget and custom SQL services (which takes query input from DataWidget and executes query with the filter).
How do I achieve the same with lists?
Appreciate your help.
Thanks,
Ravi
- Labels:
-
Connectivity
- Tags:
- list widget
- Mark as New
- Bookmark
- Subscribe
- Mute
- Subscribe to RSS Feed
- Permalink
- Notify Moderator
Hi Ravi,
Could you please elaborate more on the use case. When you say "List of Seasons" , is each Season in the List a Thing? How is the List of Seasons connected to the List of Departments? And what do you want to display on the Label Chart?
- Mark as New
- Bookmark
- Subscribe
- Mute
- Subscribe to RSS Feed
- Permalink
- Notify Moderator
Hi Janet,
The requirement is as below.
"Show Active and inactive product count for a given season and department"
I have a thing that uses OracelDB thing template and I have 3 services that returns (Infotable) Season Data , Department Data (based on Season selected) and final count Data respectively. I have it working in SQL. I just need to connect the input params from Season List to department List and then to the label chart.
Let me know if you have any query.
Thanks,
Ravi
- Mark as New
- Bookmark
- Subscribe
- Mute
- Subscribe to RSS Feed
- Permalink
- Notify Moderator
Hi Ravi,
Hope my sample is useful for you:
1. I create some Data Table to save the season, department and products

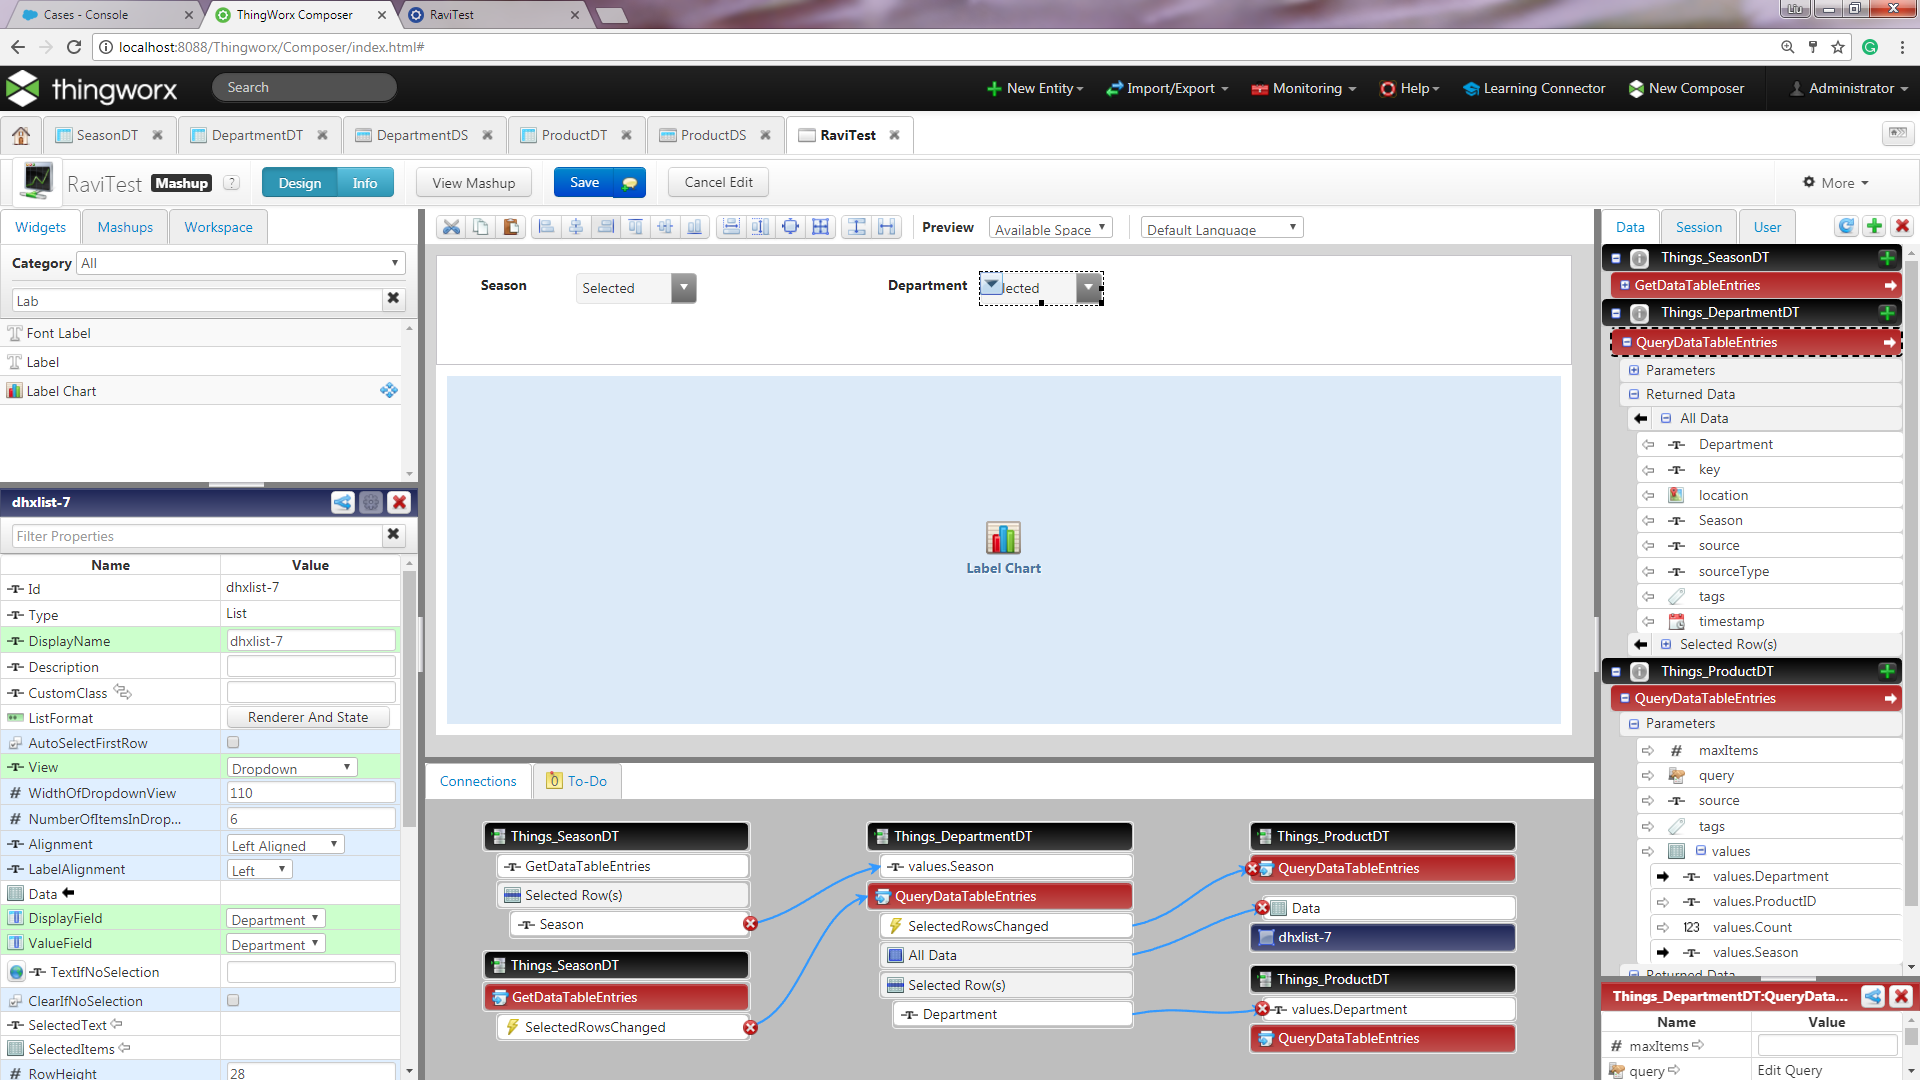
2. Create mashup as below: two list widgets and one label chart

Binding is very important:
1.set SeasonDT GetDataTableEntries mashup load event, and bind it to dropdown list
2.Bind SeasonDT -> GetDataTableEntries -> Selected Rows(s) -> Season to DepartmentDT -> QueryDataTableEntries -> Parameters -> values -> values.Season
3. Bind SeasonDT -> GetDataTableEntries -> SelectedRowChanged to DepartmentDT -> QueryDataTableEntries
4. Bind SeasonDT -> GetDataTableEntries -> Selected Rows(s) -> Season to ProductDT -> QueryDataTableEntries -> Parameters -> values -> values.Season and bind DepartmentDT -> QueryDataTableEntries -> Selected Rows(s) -> Department to ProductDT -> QueryDataTableEntries -> Parameters -> values -> values.Department
5. Bind DepartmentDT -> QueryDataTableEntries-> SelectedRowChanged to ProductDT -> QueryDataTableEntities.
6. Bind DepartmentDT to another list widget and ProductDT to Label chart widget.
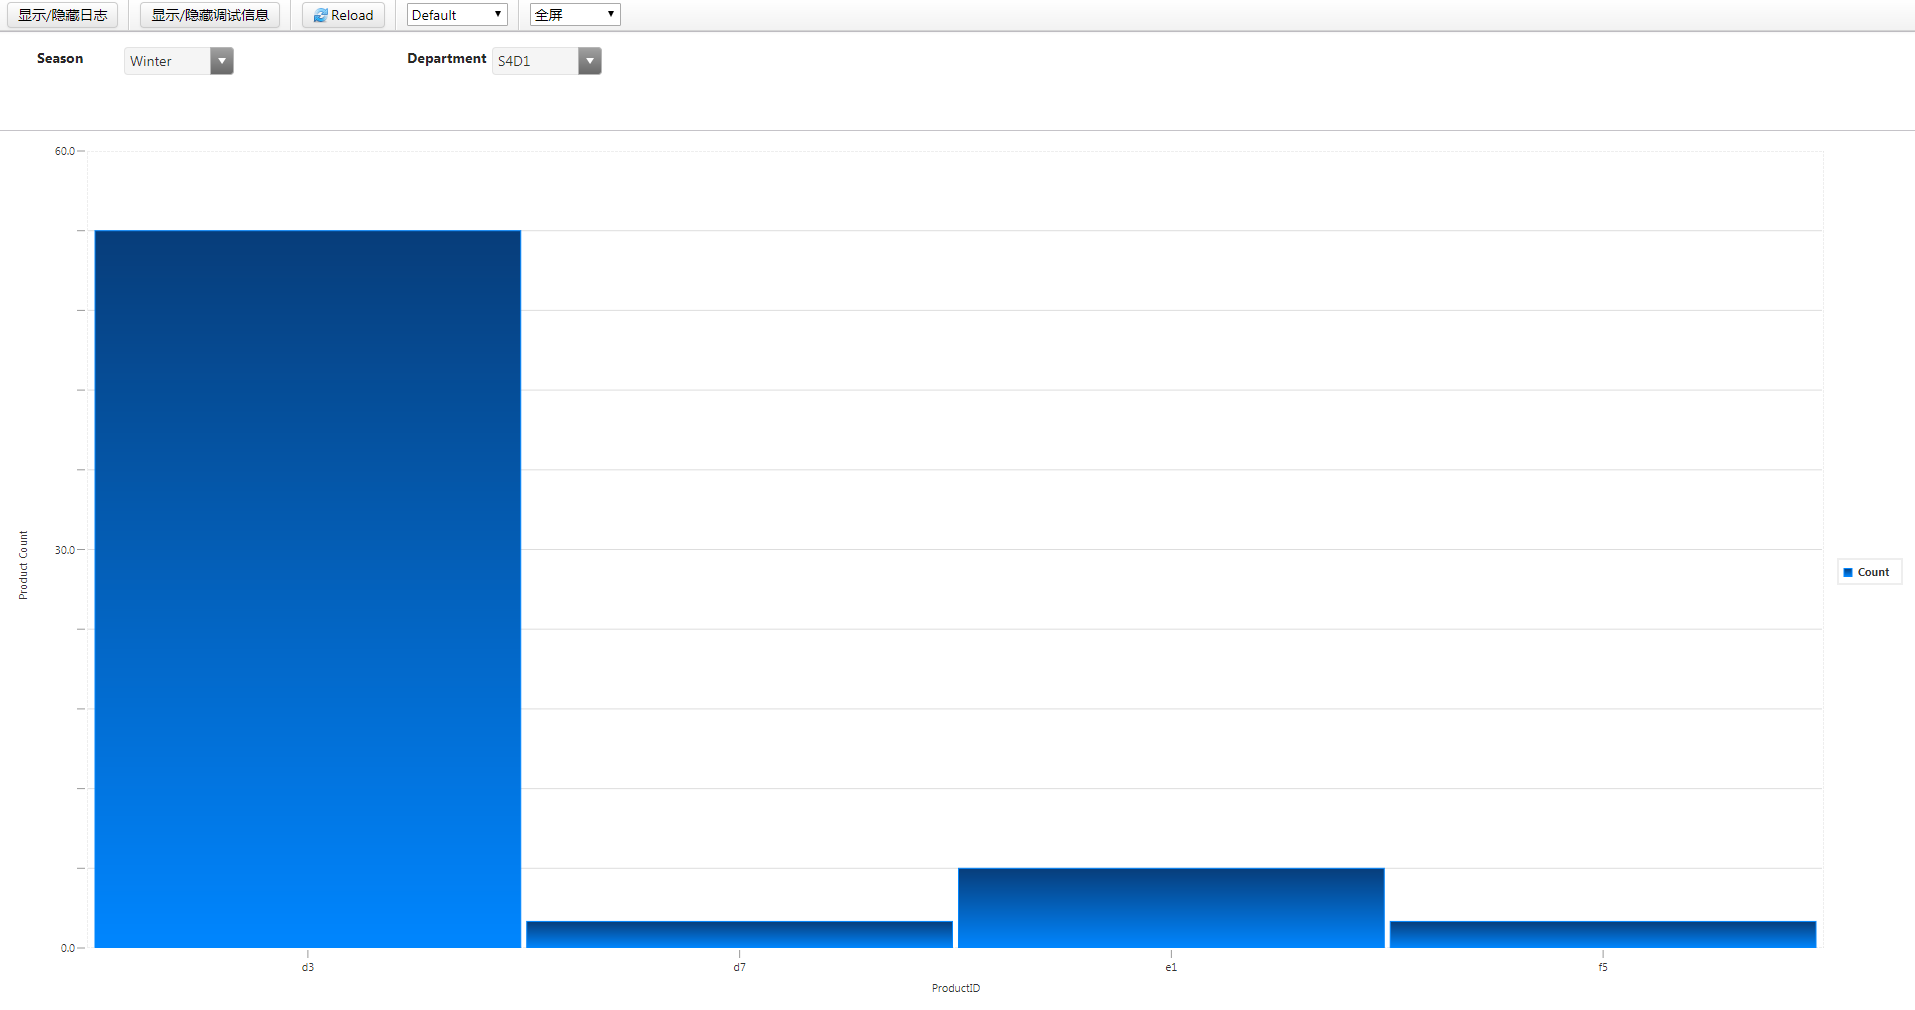
Output is something like below: After Department value is set, the label chart will query out specific records of product and count
Should you have any concern, please feel free to let me know.
Best Regards,
Lily


