
Turn on suggestions
Auto-suggest helps you quickly narrow down your search results by suggesting possible matches as you type.
Showing results for
Please log in to access translation
Turn on suggestions
Auto-suggest helps you quickly narrow down your search results by suggesting possible matches as you type.
Showing results for
- Community
- ThingWorx
- ThingWorx Developers
- What widgets do you use to create a bar / bar grap...
Translate the entire conversation x
Please log in to access translation
Options
- Subscribe to RSS Feed
- Mark Topic as New
- Mark Topic as Read
- Float this Topic for Current User
- Bookmark
- Subscribe
- Mute
- Printer Friendly Page
What widgets do you use to create a bar / bar graph?
Feb 27, 2018
09:05 PM
- Mark as New
- Bookmark
- Subscribe
- Mute
- Subscribe to RSS Feed
- Permalink
- Notify Moderator
Please log in to access translation
Feb 27, 2018
09:05 PM
What widgets do you use to create a bar / bar graph?
Hi
still now, i using time series widget to display dynamic log value(i.g. sensor data)
but some demos display log using line/bar graph in mashup
how i get line/bar graph(chart)?
i downloaded Custome chart widget from Thingworx marketstore and display log using that
but that was not show line/bar together
and Custom chart widget just display value only one
How i show log value at chart via line/bar?
I want combine a line chart and a bar chart
thanks

regard,
SeonHo Cha
Solved! Go to Solution.
ACCEPTED SOLUTION
Accepted Solutions
Feb 27, 2018
11:39 PM
- Mark as New
- Bookmark
- Subscribe
- Mute
- Subscribe to RSS Feed
- Permalink
- Notify Moderator
Please log in to access translation
Feb 27, 2018
11:39 PM
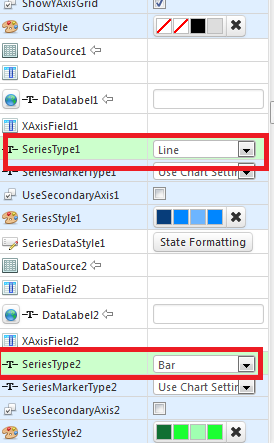
Hi SeonHo Cha,
In Label Chart, for each DataField you can choose different SeriesType i.e bar or line type.
PFA
Regards,
Velkumar R
3 REPLIES 3
Feb 27, 2018
11:39 PM
- Mark as New
- Bookmark
- Subscribe
- Mute
- Subscribe to RSS Feed
- Permalink
- Notify Moderator
Please log in to access translation
Feb 27, 2018
11:39 PM
Hi SeonHo Cha,
In Label Chart, for each DataField you can choose different SeriesType i.e bar or line type.
PFA
Regards,
Velkumar R
Feb 28, 2018
12:27 AM
- Mark as New
- Bookmark
- Subscribe
- Mute
- Subscribe to RSS Feed
- Permalink
- Notify Moderator
Please log in to access translation
Feb 28, 2018
12:27 AM
thank!
I am not accustomed to English, so what does "PFA" mean?
Feb 28, 2018
12:52 AM
- Mark as New
- Bookmark
- Subscribe
- Mute
- Subscribe to RSS Feed
- Permalink
- Notify Moderator
Please log in to access translation
Feb 28, 2018
12:52 AM
Please Find Attached


