- Community
- ThingWorx
- ThingWorx Developers
- Re: problem with time series chart
- Subscribe to RSS Feed
- Mark Topic as New
- Mark Topic as Read
- Float this Topic for Current User
- Bookmark
- Subscribe
- Mute
- Printer Friendly Page
problem with time series chart
- Mark as New
- Bookmark
- Subscribe
- Mute
- Subscribe to RSS Feed
- Permalink
- Notify Moderator
problem with time series chart
Hi all,
i read in this forum that time series chart can find the first date time column and put it as the x axis,
but for some reason it's doesn't do this trick for me., any ideas??
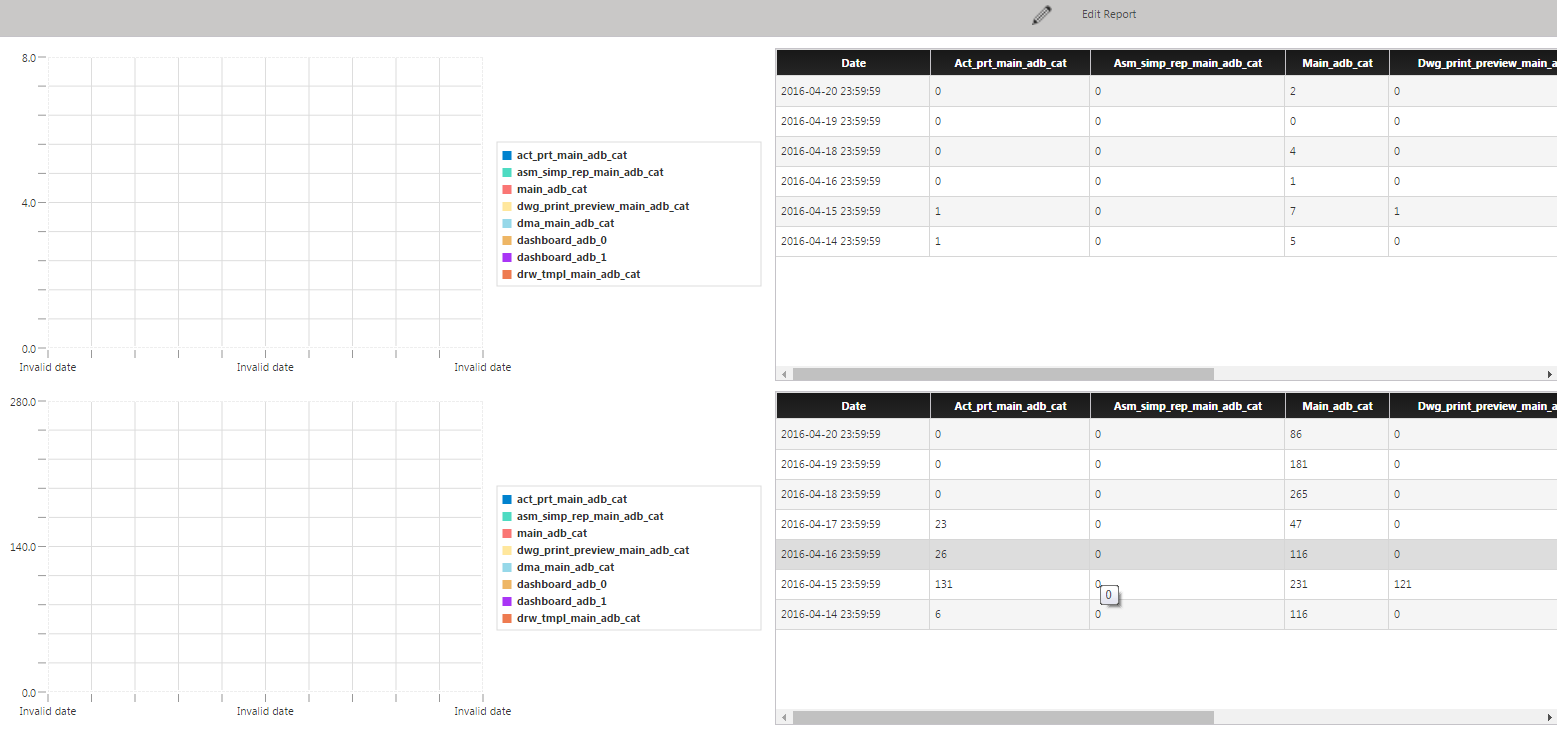
in the following example both the grid and the chart get the same input
- Mark as New
- Bookmark
- Subscribe
- Mute
- Subscribe to RSS Feed
- Permalink
- Notify Moderator
Amir, does the XAxisFormat setting on the TimeSeries Chart match the Timestamps you're providing it?
- Mark as New
- Bookmark
- Subscribe
- Mute
- Subscribe to RSS Feed
- Permalink
- Notify Moderator
thanks for the answer aanjan,yes it is matched, maybe you have any other idea?
- Mark as New
- Bookmark
- Subscribe
- Mute
- Subscribe to RSS Feed
- Permalink
- Notify Moderator
It would be helpful to see a screenshot of the property settings for the chart.
Does the chart display properly if you select all series/x-axis in properties?
Does your chart use-case prevent doing that ahead of time?
- Mark as New
- Bookmark
- Subscribe
- Mute
- Subscribe to RSS Feed
- Permalink
- Notify Moderator
thank you Mac,
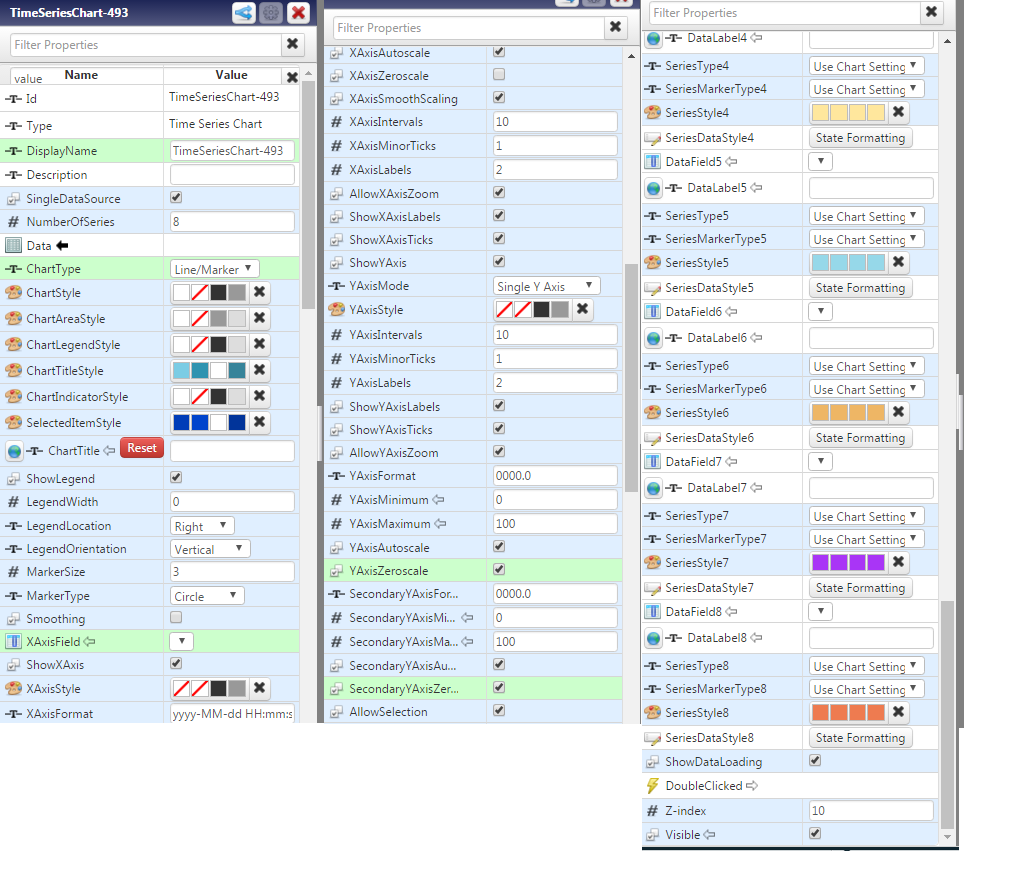
i didn't fully understand the fields you are referring to , i attached a screenshot of the time property 
- Mark as New
- Bookmark
- Subscribe
- Mute
- Subscribe to RSS Feed
- Permalink
- Notify Moderator
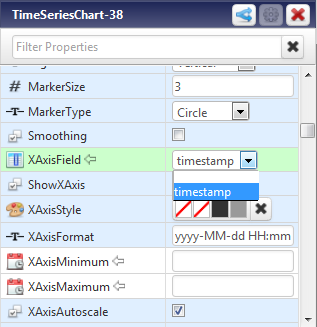
Amir, do you have valid data bound? If you look at XAxisField, it seems to be blank. With correct data, you would get a drop down with fields like 'timestamp' that you can choose for X-axis.

- Mark as New
- Bookmark
- Subscribe
- Mute
- Subscribe to RSS Feed
- Permalink
- Notify Moderator
yes the problem is that the result info-table is dynamic so i cant create a static data shape.
but i heard that time series chart can find the first column date-time column and use it as the x axis parameter
- Mark as New
- Bookmark
- Subscribe
- Mute
- Subscribe to RSS Feed
- Permalink
- Notify Moderator
How dynamic is your result set? Does it change every time? If not, there really is no reason why you can't create a static datashape which contains all the possible attributes that might be returned. TWX will take care of populating the correct columns with the returned data and that way you can ensure the timeseries chart is aware of the datashape and has access to the timestamp attribute across the x-axis.


