
Turn on suggestions
Auto-suggest helps you quickly narrow down your search results by suggesting possible matches as you type.
Showing results for
Please log in to access translation
Turn on suggestions
Auto-suggest helps you quickly narrow down your search results by suggesting possible matches as you type.
Showing results for
Community Tip - You can Bookmark boards, posts or articles that you'd like to access again easily! X
- Community
- Augmented Reality
- Vuforia Studio
- Re: How to change bar chart color
Translate the entire conversation x
Please log in to access translation
Options
- Subscribe to RSS Feed
- Mark Topic as New
- Mark Topic as Read
- Float this Topic for Current User
- Bookmark
- Subscribe
- Mute
- Printer Friendly Page
How to change bar chart color
Feb 21, 2017
11:23 PM
- Mark as New
- Bookmark
- Subscribe
- Mute
- Subscribe to RSS Feed
- Permalink
- Notify Moderator
Please log in to access translation
Feb 21, 2017
11:23 PM
How to change bar chart color
Hi,
How can I change a color of bar chart?
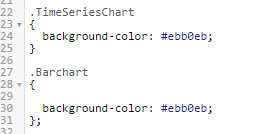
We changed the color of the "time series chart" using the same syntax.
But it doesn't apply to bar chart.
And I want to change the color of each graphs, is it possible?
Thanks.
Labels:
- Labels:
-
Coding
-
Mashup-Widget
- Tags:
- css
3 REPLIES 3
Feb 22, 2017
04:33 AM
- Mark as New
- Bookmark
- Subscribe
- Mute
- Subscribe to RSS Feed
- Permalink
- Notify Moderator
Please log in to access translation
Feb 22, 2017
04:33 AM
Yoo hwan, There seems some issue with the bar chart background. I will investigate more on it.
Meanwhile as a workaround you can add a Grid layout first and then add the bar chart in it.
Then you can set the background color of the cell (row/column) where bar chart is added.
Yes, it is possible to have different color for each graph. You just need to create different css class for each graph and map it as per your requirement i.e. add the name of the css class in the graph settings.
For e.g. you can create css classes timeseries1, timeseries2 and so on for different timeseries charts.
I hope it helps.
Feb 22, 2017
04:44 AM
- Mark as New
- Bookmark
- Subscribe
- Mute
- Subscribe to RSS Feed
- Permalink
- Notify Moderator
Please log in to access translation
Feb 22, 2017
04:44 AM
Thanks
I will do it.
But, My question does not seem to have been conveyed to you properly.
I meant that 'each graphs' are not 'time series charts' or 'bar charts'.
A first stick, a second stick and a third stick (or more) on the same bar chart.
I want to show it like this.
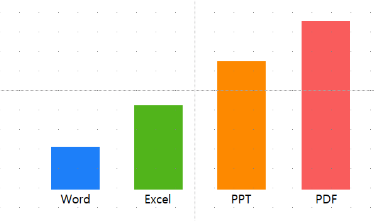
Can I do it?
Jun 20, 2017
04:47 AM
- Mark as New
- Bookmark
- Subscribe
- Mute
- Subscribe to RSS Feed
- Permalink
- Notify Moderator
Please log in to access translation
Jun 20, 2017
04:47 AM
I too am looking for a way to do this.


