
Turn on suggestions
Auto-suggest helps you quickly narrow down your search results by suggesting possible matches as you type.
Showing results for
Please log in to access translation
Turn on suggestions
Auto-suggest helps you quickly narrow down your search results by suggesting possible matches as you type.
Showing results for
Community Tip - Visit the PTCooler (the community lounge) to get to know your fellow community members and check out some of Dale's Friday Humor posts! X
- Community
- PLM
- Windchill Discussions
- How to Configure Automatic Thread Dumps to Occur W...
Translate the entire conversation x
Please log in to access translation
Options
- Subscribe to RSS Feed
- Mark Topic as New
- Mark Topic as Read
- Float this Topic for Current User
- Bookmark
- Subscribe
- Mute
- Printer Friendly Page
How to Configure Automatic Thread Dumps to Occur When there is a Problem
Oct 03, 2012
04:20 PM
- Mark as New
- Bookmark
- Subscribe
- Mute
- Subscribe to RSS Feed
- Permalink
- Notify Moderator
Please log in to access translation
Oct 03, 2012
04:20 PM
How to Configure Automatic Thread Dumps to Occur When there is a Problem
When there is 'weird' stuff going on with performance or stability of a Windchill system one of the things that is often most helpful to diagnose the problem are thread dumps. Thread dumps show what every thread in a MethodServer are doing at that instant, one ore of these can be used to then construct a hypothesis of what the underlying problem is (database query, looping in the code, no work getting to the server etc.) this is particularly important for operations that appear to be hung (usually they aren't really hung but executing or blocked by something else).
There are a couple of ways for an administrator to initiate thread dumps. Generally generating cluster wide thread dumps is easiest and it's not necessary to determine the MethodServer process identifier to target for generating a thread dump for either which can be tricky. Cluster wide thread dumps can be initiated using the jsp page or by using windchill wt.util.jmx.GetClusterStacks from a Windchill shell in R9.1 M50 systems and later. There are also the 'old fashioned' ways of getting thread dumps by using 'cntrl break' in the command window on a Windows machine or 'kill -3 <pid>' on a Unix machine, but these last two aren't used very often anymore. The last way to generate a thread dump is to have JMX initiate the thread dump when certain thresholds are exceeded, this also prevents the administrator from needing to take an action when a problem, the thread dump happens automatically.
The following example procedure details how to configure the method server to automatically generate full stack traces when the execution time of a queue entry in the UserWorkQueue (which processes expression code) exceeds five minutes (300 seconds). This same procedure can be used to generate thread dumps for numerous other notification thresholds which are available under come.ptc --> Monitors.
------------
1) Open JConsole and connect to the ServerManager. For example run the following command in a Windchill shell:
windchill wt.util.jmx.SMJconsole
2) Navigate to com.ptc-->MethodServers-->MethodServer:PID-->com.ptc-->NotificationHandlers-->QueueNotifier-->Operations
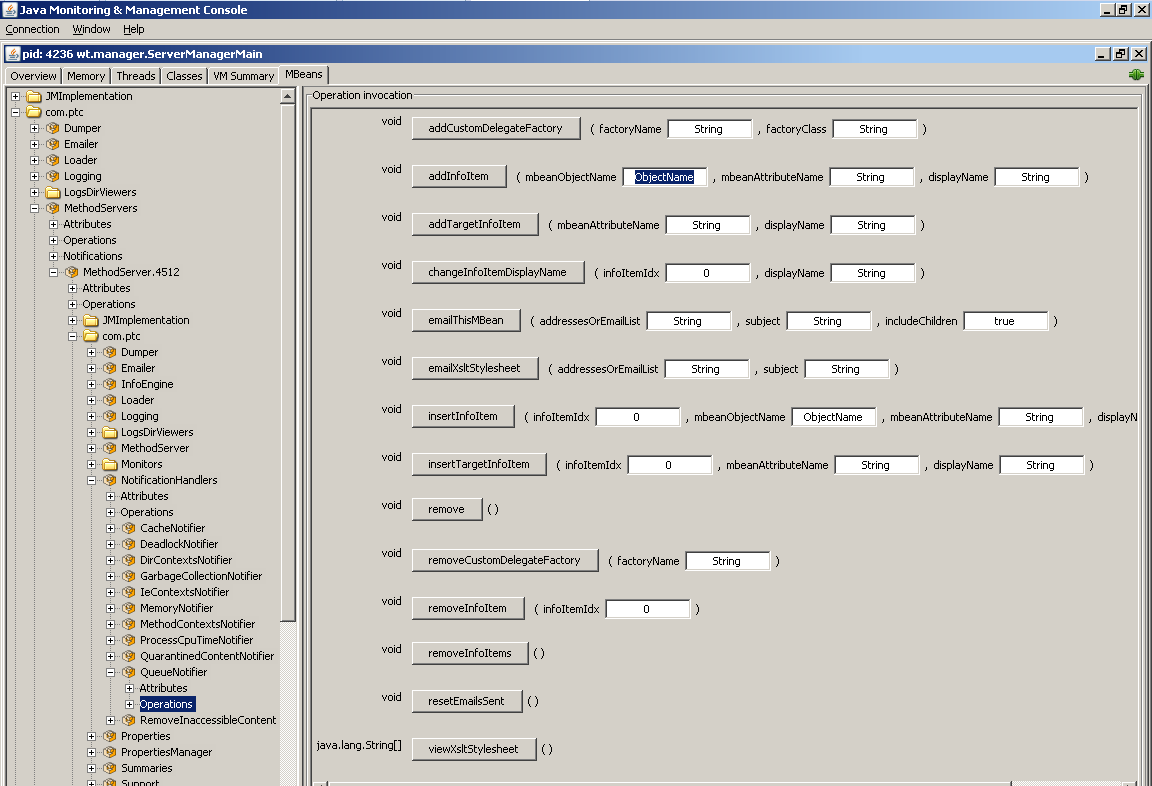
3) Enter the following arguments to the addInfoItem method.
mBeanObjectName=com.ptc:wt.subsystem=Dumper
mBeanAttributeName=FullStackTrace
displayName=displayName=FullStackTrace
Click the addInfoItem button to add this method. You should see a "Method successfully executed" pop up.
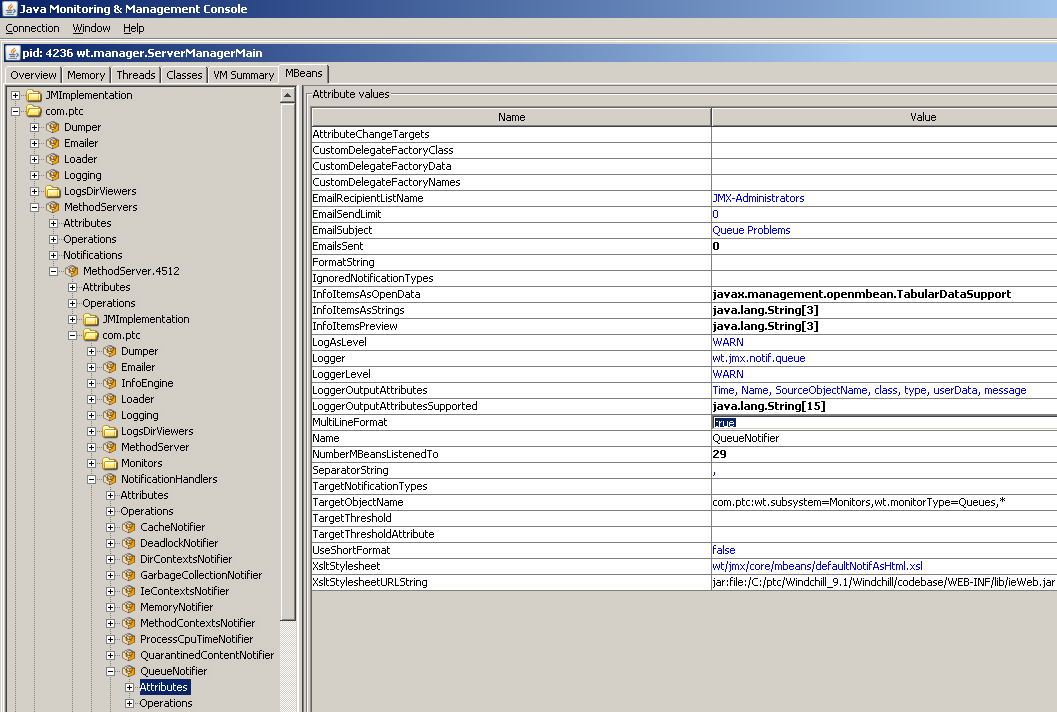
4) Switch to Attributes node for the QueueNotifier, set the attribute MultiLineFormat to true.
5) Navigate to com.ptc-->MethodServers-->MethodServer:PID-->com.ptc-->Monitors-->Queue-->WfUserWorkQueue-->Attributes
6) Change EntryExecutionTimeThresholdSec from 900 to 300
7) Change MinMinutesBetweenNotifications from 30 to 1
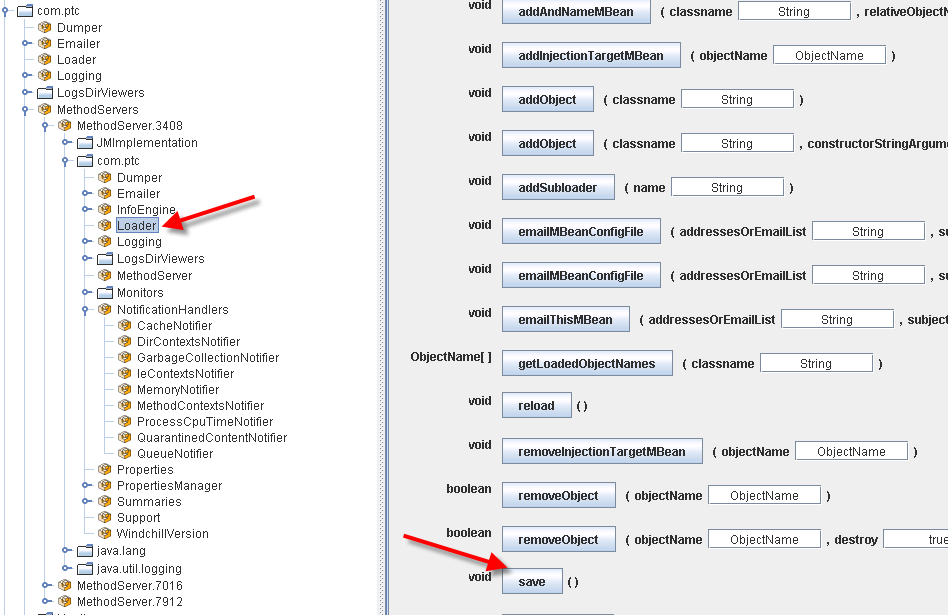
😎 Navigate to com.ptc-->MethodServers-->MethodServer:PID-->com.ptc-->Loader-->Operations
Click the save method to save the changes made to the QueueNotifier and WfUserWorkQueue. You should see a "Method successfully executed" pop up.
Labels:
- Labels:
-
Other
6 REPLIES 6
Oct 03, 2012
04:50 PM
- Mark as New
- Bookmark
- Subscribe
- Mute
- Subscribe to RSS Feed
- Permalink
- Notify Moderator
Please log in to access translation
Oct 03, 2012
04:50 PM
Very good to know sir. I will certainly keep this in mind the next time that I run into an issue that deems thread dumps necessary.
I am curious about a few things:
- Where will the dumps be located?
- What will the dumps be named?
- Will the dumps be appended as thresholds are exceeded over time or does JMX create new files?
- How will this apply to a clustered environment?
Thanks so much for your posts!
Oct 03, 2012
10:07 PM
- Mark as New
- Bookmark
- Subscribe
- Mute
- Subscribe to RSS Feed
- Permalink
- Notify Moderator
Please log in to access translation
Oct 03, 2012
10:07 PM
Andy, good questions.
- Where will the dumps be located?
[Stephen] In the MethodServer Log4J file
- What will the dumps be named?
[Stephen] they are located within the file, I usually search for 'dump' to locate them.
- Will the dumps be appended as thresholds are exceeded over time or does JMX create new files?
[Stephen] the thread dumps will be added to the current MethodServer Log4J file, the current file will change over time as the log file passes it's wrap threshold size.
- How will this apply to a clustered environment?
[Stephen] I wondered about that as I was writing the post above. Step #8, lists the MethodServer:PID as required, making this process specific to a specific MethodServer. A future to-do for me is to figure out how to do this in general. I think it's possible, at one point development I think somewhere in the later builds of R9.1 Windchill was configured so thread dumps occured under low memory conditions, but that doesn't seem to be the default configuration any longer. However it does suggest that a more general configuration should be possible. If you (or someone else) wants to work on it, I'd like to see the steps 🙂
Oct 03, 2012
11:44 PM
- Mark as New
- Bookmark
- Subscribe
- Mute
- Subscribe to RSS Feed
- Permalink
- Notify Moderator
Please log in to access translation
Oct 03, 2012
11:44 PM
Thanks a lot Stephen, I appreciate it. I will certainly look into this hypothesis of yours over the weekend and report back in.
Dec 19, 2012
06:59 PM
- Mark as New
- Bookmark
- Subscribe
- Mute
- Subscribe to RSS Feed
- Permalink
- Notify Moderator
Please log in to access translation
Dec 19, 2012
06:59 PM
Hi Stephen.
I like the recommended practice. I was trying to adjust the MinMinutesBetweenNotifications parameter, but I can't get the new value to stick after a restart of the method server. I carefully followed your procedure to run the save operation in the loader, but no matter what I do, the value reverts back to 30 mins. Any thoughts?
Jan 08, 2013
10:12 AM
- Mark as New
- Bookmark
- Subscribe
- Mute
- Subscribe to RSS Feed
- Permalink
- Notify Moderator
Please log in to access translation
Jan 08, 2013
10:12 AM
Ryan,
You're right, changes made to queue attributes are not maintained when the MethodServer restarts as they should be. I've opened an SPR (2163001) to have development correct this problem. I appreciate you finding and reporting this problem.
Stephen
Jan 09, 2013
09:34 AM
- Mark as New
- Bookmark
- Subscribe
- Mute
- Subscribe to RSS Feed
- Permalink
- Notify Moderator
Please log in to access translation
Jan 09, 2013
09:34 AM
I heard back from development with a workaround. I'm pushing back to see if there is away this step can be eliminated for all MBean changes, because until the change isn't there when the MS is restarted it's not possible to know wether the attribute being changed will have the new value or the old one and wether the additional step(s) of injecting the MBean will need to be done.
e-mail from the developer:
----------------------------------------
By default the only beans that are automatically loaded and (optionally) saved are those which are either created by JMX or those which have been injected.
To add a particular bean (and capture its current state) it must be injected into the configuration. This is done via the Loader/operations tab (in jconsole) as follows:
start jconsole
navigate to the bean to be modified & change desired attributes
note the full name (path) of the bean
navigate to the loader/operations tab
invoke addInjectionTargetMBean (name-of-desired-bean)
invoke save
By way of example, I modified the minutes between notifications time for the NotificationQueue
Injected it into the configuration:
addInJectionTargetMBean (com.ptc:wt.subsystem=Monitors,wt.monitorType=Queues,Name=NotificationQueue)
And saved the configuration. When I restarted Windchill the minimum notification interval change was restored.


