Community Tip - Need to share some code when posting a question or reply? Make sure to use the "Insert code sample" menu option. Learn more! X
- Community
- PLM
- Windchill Discussions
- Report not working after Release Update 10.2 M020-...
- Subscribe to RSS Feed
- Mark Topic as New
- Mark Topic as Read
- Float this Topic for Current User
- Bookmark
- Subscribe
- Mute
- Printer Friendly Page
Report not working after Release Update 10.2 M020-CPS05 -> CPS10
- Mark as New
- Bookmark
- Subscribe
- Mute
- Subscribe to RSS Feed
- Permalink
- Notify Moderator
Report not working after Release Update 10.2 M020-CPS05 -> CPS10
Hi,
we have the problem that a specific report is not working any more after updating from
10.2 M020-CPS05 to 10.2 M020-CPS10
and
Oracle 11g to Oracle 12c
Java 1.7.0_80-b15 ("Version 7 Update 80") is installed on the client machines.
The report has to do with promotion requests and the source can be found here:
Query Builder Report: getting the related Promotion Requests of a Drawing
If it's needed, I can post the exact report here.
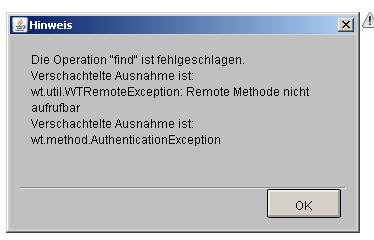
The page is loading continuously for a very very long time. Sometimes it gives out a report, sometimes an error occurs (in German but should give a hint):

Other "smaller" reports work without any delay.
Can anybody confirm this? This is a pretty urgent issue since the report is used by many persons every day.
Thanks!
David
- Labels:
-
Other
- Mark as New
- Bookmark
- Subscribe
- Mute
- Subscribe to RSS Feed
- Permalink
- Notify Moderator
David,
have you tried selecting only one attribute at a time and then run your report?
Maybe some DB index could miss, so running your report only with one attribute you could understand if this is your case and which attribute impact on report performance.
- Mark as New
- Bookmark
- Subscribe
- Mute
- Subscribe to RSS Feed
- Permalink
- Notify Moderator
Hi Marco,
I followed your hint but this doesn't work. It always takes that long.
I have to correct my first post: the error which is shown there does NOT have to do with the behaviour of the report execution! It was an unhappy coincidence that the error came up while running the report.
It's "only" that the report takes very long (about 6-10 minutes. before update: 2-8 seconds).
David
- Mark as New
- Bookmark
- Subscribe
- Mute
- Subscribe to RSS Feed
- Permalink
- Notify Moderator
David,
my hint was because it seems some kind of performance problem.
How many columns (attributes) and rows have your report?
Did you know the differences that exists from selecting in query builder attributes with the red arrow instead of others?
Sorry if I ask something that you already know.
- Mark as New
- Bookmark
- Subscribe
- Mute
- Subscribe to RSS Feed
- Permalink
- Notify Moderator
Hi Mario,
the performance was no issue before implementing the updates. What could be the cause after updating? Maybe security settings? But then I believe it should not work any more.
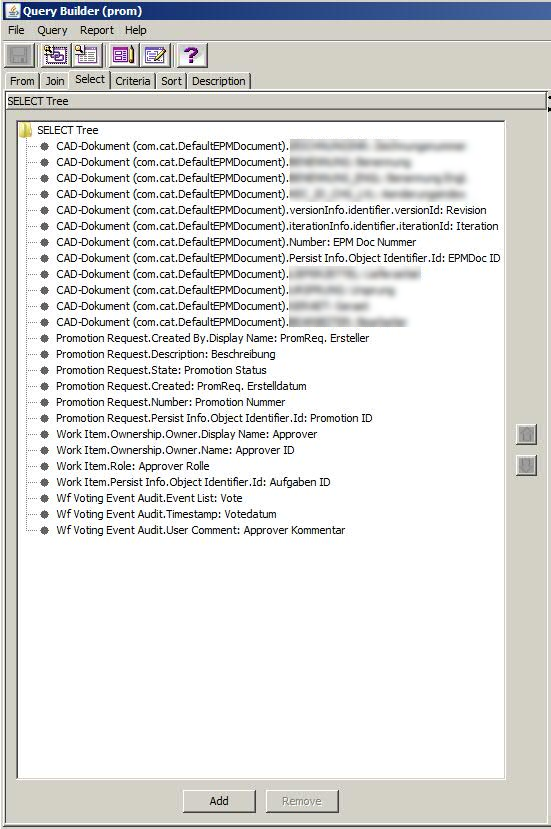
The report has 25 columns and the last one I ran had 16 rows. It takes about 6 minutes to be generated. There is no recognizable influence on the server performance (CPU & RAM) when executing several of these reports parallel.
I run the report with a direct URL with parameters included - not within the standard "generate" page. So I don't know what you mean with the red arrow. ![]()
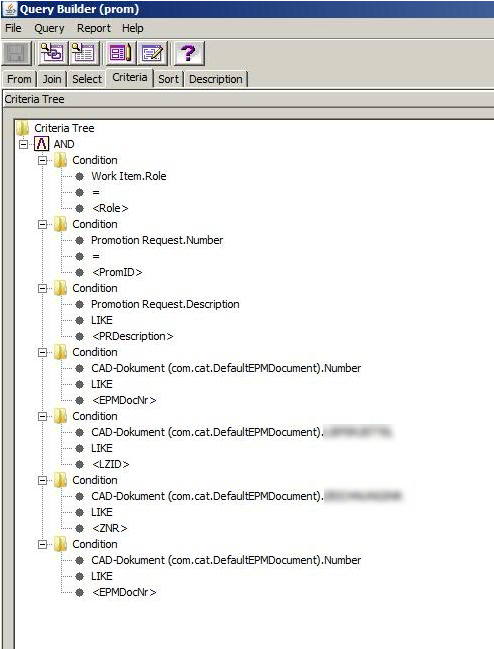
These are the exact report settings:


Thanks!
David
- Mark as New
- Bookmark
- Subscribe
- Mute
- Subscribe to RSS Feed
- Permalink
- Notify Moderator
David,
starting from Windchill 10 it is no more necessary to use criteria to choose an attribute as a filter.
It's sufficient to use a persistent attribute (those with green arrow), instead of a derived.
In this document Resource for reporting there is an attached presentation https://www.ptcusercommunity.com/servlet/JiveServlet/download/6348-56-73173/_Reporting6.2.pptx
Take a look at slide 15 of this presentation to see what I mean with green arrow.
- Mark as New
- Bookmark
- Subscribe
- Mute
- Subscribe to RSS Feed
- Permalink
- Notify Moderator
Is this performance issue only with reports? I have seen issues where upgrade tool drops certain database indices. It is worth ensuring the presence of all required indices. https://support.ptc.com/appserver/cs/view/solution.jsp?n=CS98135.
Please update the database stats as well.
Also use of like operator with leading wild characters reduces the chance of using index than using a equal operator on a field which is covered by indexes. You can try to profile the action to identify where the time is actually spent.
Thanks
Binesh
Barry Wehmiller International


