
Turn on suggestions
Auto-suggest helps you quickly narrow down your search results by suggesting possible matches as you type.
Showing results for
Please log in to access translation
Turn on suggestions
Auto-suggest helps you quickly narrow down your search results by suggesting possible matches as you type.
Showing results for
Community Tip - Did you get called away in the middle of writing a post? Don't worry you can find your unfinished post later in the Drafts section of your profile page. X
- Community
- PLM
- Windchill Discussions
- Re: Slow behavior between CREO 2 and Windchill 10....
Translate the entire conversation x
Please log in to access translation
Options
- Subscribe to RSS Feed
- Mark Topic as New
- Mark Topic as Read
- Float this Topic for Current User
- Bookmark
- Subscribe
- Mute
- Printer Friendly Page
Slow behavior between CREO 2 and Windchill 10.2
May 19, 2015
09:27 AM
- Mark as New
- Bookmark
- Subscribe
- Mute
- Subscribe to RSS Feed
- Permalink
- Notify Moderator
Please log in to access translation
May 19, 2015
09:27 AM
Slow behavior between CREO 2 and Windchill 10.2
First these are the builds of the programs:
CREO 2 m110 or m150
Windchill 10.2 m020
This is the behavior that I am seeing when first starting up CREO tied to Windchill.
I am in CREO and activate a new workspace. Then I close CREO. The next time I launch CREO, it takes 2-3 minutes to open, no matter how many objects are in the workspace. If I close CREO and launch it again, then it opens in 14-20 seconds. If I switch workspaces again, close and reopen, then it is the 2-3 minutes to launch. At first I thought it was the new VOIP phones that they are now running our computers through, but I finally was able to replicate this issue over and over and in succession.
Anyone have any ideas? I have done the registry updates that they recommend and it doesn't help.
Sorry for posting this twice, I fat fingered something and it posted on it's own.
Thank you,
Brian
Labels:
- Labels:
-
Other
- Tags:
- creo_windchill
11 REPLIES 11
May 26, 2015
04:49 AM
- Mark as New
- Bookmark
- Subscribe
- Mute
- Subscribe to RSS Feed
- Permalink
- Notify Moderator
Please log in to access translation
May 26, 2015
04:49 AM
Hi Brian,
Is this after update to Creo 2 and WNC 10.2 M020? I see slowness in several workspace operations compared to WNC 10.0. (open after activate, refresh after create new part)
Patrick
May 29, 2015
08:53 AM
- Mark as New
- Bookmark
- Subscribe
- Mute
- Subscribe to RSS Feed
- Permalink
- Notify Moderator
Please log in to access translation
May 29, 2015
08:53 AM
Hello Patrick,
Yes this was after updating to WC 10.2 M020, but it didn't happen right away. It seemed to be a month or so after migrating. However we might have found the cause. About the time this started happening we installed a VOIP system. Our old phone system wasn't VOIP. So yesterday we did a test with my system. We unplugged me from all the stuff related to the new phone system. With testing I could open CREO in less than 15 seconds, and that was with logging into WC. We plugged everything back up and it took over 3 minutes for CREO to start. We are going to go down that avenue and hopefully there is just a setting that was missed in the setup of the new system.
Brian
May 29, 2015
06:43 PM
- Mark as New
- Bookmark
- Subscribe
- Mute
- Subscribe to RSS Feed
- Permalink
- Notify Moderator
Please log in to access translation
May 29, 2015
06:43 PM
Brian,
Sounds like CS201732 (When the config.pro file points to a wtpub:// location, Creo Parametric does a full workspace cache request rather than a normal refresh upon launch).
Do you have any config options that point to a Windchill folder location?
Craig
May 29, 2015
08:59 PM
- Mark as New
- Bookmark
- Subscribe
- Mute
- Subscribe to RSS Feed
- Permalink
- Notify Moderator
Please log in to access translation
May 29, 2015
08:59 PM
Craig,
I understand that there is this issue identified. How though could it be working fine for over a month and a half and then when we go to VOIP, it just start happening and we have a hard time reproducing when we unplug from VOIP? Is m160 out yet?
Brian
May 31, 2015
07:07 PM
- Mark as New
- Bookmark
- Subscribe
- Mute
- Subscribe to RSS Feed
- Permalink
- Notify Moderator
Please log in to access translation
May 31, 2015
07:07 PM
Do you have QoS enabled for VOIP? This might be prioritizing the traffic
Jun 01, 2015
08:34 AM
- Mark as New
- Bookmark
- Subscribe
- Mute
- Subscribe to RSS Feed
- Permalink
- Notify Moderator
Please log in to access translation
Jun 01, 2015
08:34 AM
We do not have QoS enabled.
Jun 01, 2015
08:36 AM
- Mark as New
- Bookmark
- Subscribe
- Mute
- Subscribe to RSS Feed
- Permalink
- Notify Moderator
Please log in to access translation
Jun 01, 2015
08:36 AM
Craig,
I just downloaded M160, installed it and tried it. It made no difference.
Brian
Jun 01, 2015
11:01 AM
- Mark as New
- Bookmark
- Subscribe
- Mute
- Subscribe to RSS Feed
- Permalink
- Notify Moderator
Please log in to access translation
Jun 01, 2015
11:01 AM
Brian,
QoS can potentially prioritize certain types of network traffic (eg. give VOIP traffic a higher priority than other traffic so your phone calls have better quality). Doing something like that will not help with Creo performance.
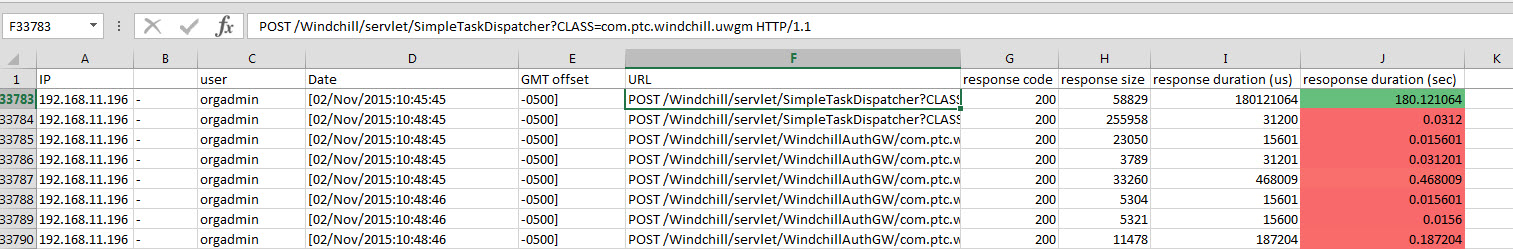
I'm starting to wonder if VOIP or something else is saturating your network bandwidth and causing the performance issue to occur. We should, however, first rule out poor server performance by taking a quick look at the Apache access.log that covers the time when you launch Creo and browse to the Workspace. You should see around 25 requests and if you parse a log snippet with Excel (open in Excel using space delimited), can quickly/easily see how long each request took to process as each line in the log has the response duration in microseconds. Adding a new column that calculates how long the request took to process in seconds is an easy addition:

Can you get that detail?
Craig
Nov 02, 2015
01:55 PM
- Mark as New
- Bookmark
- Subscribe
- Mute
- Subscribe to RSS Feed
- Permalink
- Notify Moderator
Please log in to access translation
Nov 02, 2015
01:55 PM
Hello Craig,
Sorry it has taken so long to get this to you but here it is.
Brian
Nov 13, 2015
02:39 PM
- Mark as New
- Bookmark
- Subscribe
- Mute
- Subscribe to RSS Feed
- Permalink
- Notify Moderator
Please log in to access translation
Nov 13, 2015
02:39 PM
That log shows that one of the requests is taking 180 seconds for a response. So, this isn't a networking issue, but an issue on the server side. The next step is to determine what the Method Server is doing during the three minutes it takes to process the request. If you're using PSM, then you can take a look at this transaction in the PSM to see where the time is being spent. If you're not using the PSM, then you can use something like the Windchill Profiler to capture the issue:
Nov 13, 2015
04:51 PM
- Mark as New
- Bookmark
- Subscribe
- Mute
- Subscribe to RSS Feed
- Permalink
- Notify Moderator
Please log in to access translation
Nov 13, 2015
04:51 PM
Have you done any server tuning (https://support.ptc.com/appserver/cs/view/solution.jsp?n=CS24192)?
You could also enable some debug EPM logging on the Method Server (https://support.ptc.com/appserver/cs/view/solution.jsp?n=CS140108) to capture additional detail about the long running transaction. It doesn't capture database time like the Windchill Profiler but can in many cases point where the issue is.
Collecting database performance detail (https://support.ptc.com/appserver/cs/view/solution.jsp?n=CS46060) may also be of interest.


