
Turn on suggestions
Auto-suggest helps you quickly narrow down your search results by suggesting possible matches as you type.
Showing results for
Please log in to access translation
Turn on suggestions
Auto-suggest helps you quickly narrow down your search results by suggesting possible matches as you type.
Showing results for
Community Tip - Need to share some code when posting a question or reply? Make sure to use the "Insert code sample" menu option. Learn more! X
Translate the entire conversation x
Please log in to access translation
Options
- Subscribe to RSS Feed
- Mark Topic as New
- Mark Topic as Read
- Float this Topic for Current User
- Bookmark
- Subscribe
- Mute
- Printer Friendly Page
Generating Polar Histograms in PTC Mathcad
Jun 10, 2013
08:50 AM
- Mark as New
- Bookmark
- Subscribe
- Mute
- Subscribe to RSS Feed
- Permalink
- Notify Moderator
Please log in to access translation
Jun 10, 2013
08:50 AM
Generating Polar Histograms in PTC Mathcad
By T. Matthew Evans
About this worksheet:
- Demonstrates how to plot polar histograms
- Applicable across all industries and for new PTC Mathcad users
- Performs plotting polar histograms, series of functions, "line" type trace, bins, theta(intvl) function, polar_accum function, etc
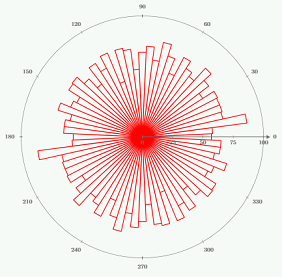
This worksheet teaches you how to plot a polar histogram using PTC Mathcad software. A polar histogram is useful because it is a good way of presenting and analyzing data that quantifies a set of measurements with respect to their orientation in space. When operating PTC Mathcad, you must use a series of user-defined functions. Generally, you would want to use PTC Mathcad's polar plotting functions in conjunction with a "line" type trace to generate the polar histograms.
For each angular value, four radius values are necessary. These create the vertices of a closed triangle encompassing the measurements in an angular interval. You must then define the bins, sort the data into these bins, you can generate the polar histogram by using the polar plotting abilities of PTC Mathcad. You can:
- use the function theta(intvl) to generate the angular measure for plotting the bins of size intvl (in degrees)
- use the function polar_count to calculate the frequency of measurements in vector v and assign them to the bins
- consider a vector with angle measurements
- create a polar histogram of the vector with 5-degree bins
If you need to classify other measurements based on their orientation in space you can also use function polar_accum. This worksheet using PTC Mathcad takes you through the steps above to create a polar histogram and also provides you with an example using the function polar_accum. Notation, data, formulas, solutions, and histograms are all provided to aid you in your own calculations.
Download and explore this worksheet yourself! You can download a free lifetime copy of PTC Mathcad Express and get 30 days of full functionality.
Labels:
- Labels:
-
Algebra_Geometry
0 REPLIES 0


