Community Tip - Want the oppurtunity to discuss enhancements to PTC products? Join a working group! X
- Community
- Creo+ and Creo Parametric
- 3D Part & Assembly Design
- Re: RPT file and displacement plot have different ...
- Subscribe to RSS Feed
- Mark Topic as New
- Mark Topic as Read
- Float this Topic for Current User
- Bookmark
- Subscribe
- Mute
- Printer Friendly Page
RPT file and displacement plot have different values
- Mark as New
- Bookmark
- Subscribe
- Mute
- Subscribe to RSS Feed
- Permalink
- Notify Moderator
RPT file and displacement plot have different values
Hi all,
I am running a simulation of a part in CREO Simulate and the RPT output from the simulation does not match what the displacement plot shows when viewed in the simulation results. I have checked the units and the RPT file should be set to output inches (the part units setup is set to CREO default), and I don't think the RPT file can be referencing another run because I watched it output these numbers as it completed the most recent run. The simulation window is set to display the displacement in inches as well. The legend is set to view max and the info > model max tool displays the same displacement. I have never noticed this happen before, and am at a loss for what could be wrong and for what output to believe. Has anyone else run into this issue?

Thanks in advance,
Matt P.
This thread is inactive and closed by the PTC Community Management Team. If you would like to provide a reply and re-open this thread, please notify the moderator and reference the thread. You may also use "Start a topic" button to ask a new question. Please be sure to include what version of the PTC product you are using so another community member knowledgeable about your version may be able to assist.
- Labels:
-
General
- Tags:
- creo
- creo_simulate
- Mark as New
- Bookmark
- Subscribe
- Mute
- Subscribe to RSS Feed
- Permalink
- Notify Moderator
Matt,
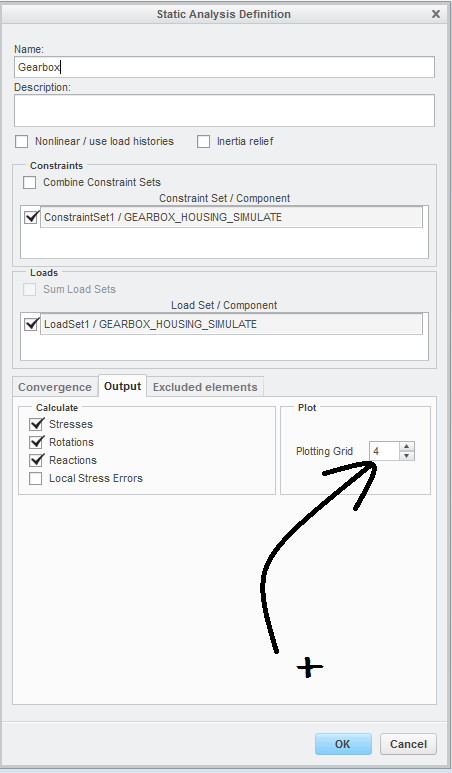
Try to increase the plotting grid value to the highest value possible and run the analysis again.

- Mark as New
- Bookmark
- Subscribe
- Mute
- Subscribe to RSS Feed
- Permalink
- Notify Moderator
Thanks Ruben, but this didn't seem to work, it still gives the same result in the RPT and in the display.
Matt P.
- Mark as New
- Bookmark
- Subscribe
- Mute
- Subscribe to RSS Feed
- Permalink
- Notify Moderator
If I set up a default view from simulate, no scale is shown. If I use one of my templates, I see a scale of 2.26E1; both result screens show the same maximum displacement of 0.053" where my report shows 0.112".
- Mark as New
- Bookmark
- Subscribe
- Mute
- Subscribe to RSS Feed
- Permalink
- Notify Moderator
Unfortunately, I can't share the model.
- Mark as New
- Bookmark
- Subscribe
- Mute
- Subscribe to RSS Feed
- Permalink
- Notify Moderator
Mat,
What version & cut of the s/w are you using?
- Mark as New
- Bookmark
- Subscribe
- Mute
- Subscribe to RSS Feed
- Permalink
- Notify Moderator
Release 2.0 of Creo M160
- Mark as New
- Bookmark
- Subscribe
- Mute
- Subscribe to RSS Feed
- Permalink
- Notify Moderator
Matt,
Do you have multiple load sets in your model? If yes then are you running for combined load sets?
This might be one of the reason for the difference in the results. try to run individual load and check.
Manjunath
- Mark as New
- Bookmark
- Subscribe
- Mute
- Subscribe to RSS Feed
- Permalink
- Notify Moderator
In the original model, there wee multiple load sets. Each run was only using one of the loadsets though. This new model I made only has one load set and I see the same issue still.
- Mark as New
- Bookmark
- Subscribe
- Mute
- Subscribe to RSS Feed
- Permalink
- Notify Moderator
So, I found the cause of this issue, but have no idea why it happens.
I was attaching an external load to my model using rigid links; there is an external point mass and I rigidly linked it to some mounting holes on the model.
When I remove the links, the RPT file and results window agree on the result perfectly.
That seems a bit bizarre to me but it resolved the discrepancy. If anyone has any thoughts on why this happened please feel free to share...
- Mark as New
- Bookmark
- Subscribe
- Mute
- Subscribe to RSS Feed
- Permalink
- Notify Moderator
- Mark as New
- Bookmark
- Subscribe
- Mute
- Subscribe to RSS Feed
- Permalink
- Notify Moderator
No, I am applying a gravity load to the system and I get an error with selecting inertia relief.
- Mark as New
- Bookmark
- Subscribe
- Mute
- Subscribe to RSS Feed
- Permalink
- Notify Moderator
Matthew,
You should have made a simple model that is not confidential; one that tests the issue.
I have reverse engineered the attached model from the above discussion.
As I type I have also just realised that I did this in Creo3.0 M030 and not your version so you may not be able to open it. I will remodel tomorrow if you can't.
Description
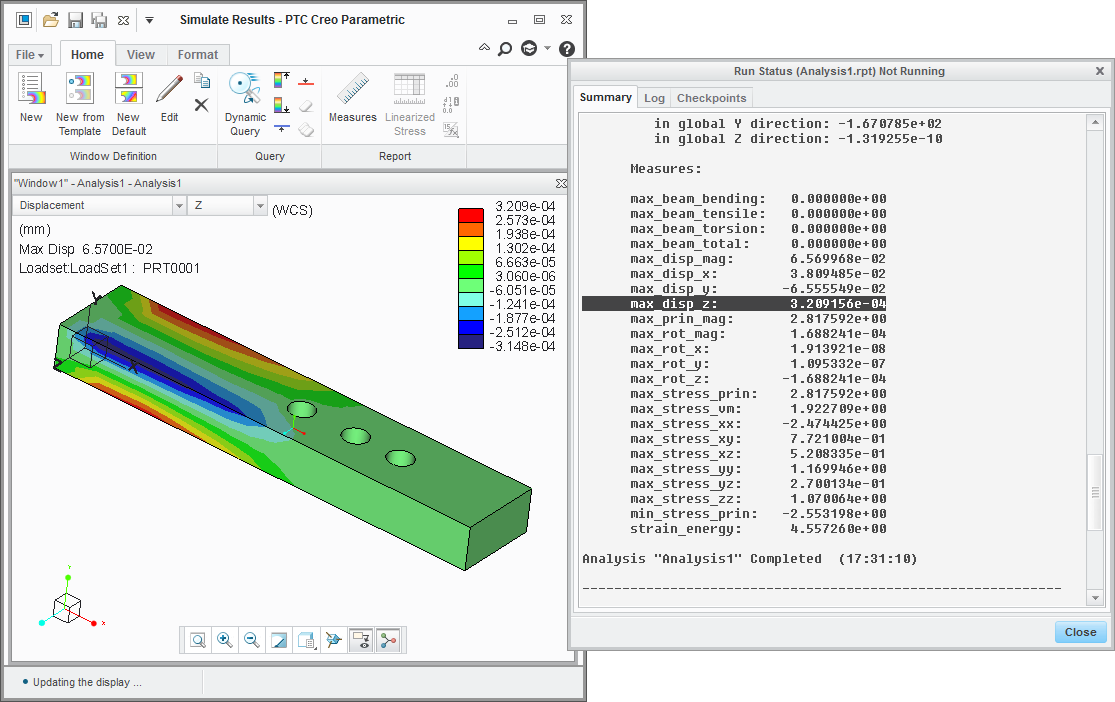
There is a simple cantilever with some holes, a mass at some distance above the central hole.
A gravity load acting in X and Y directions.
The cantilever is fully fixed at the left end.
I get the following
MAX_DISP_X is DIFFERENT to the legend max

The MAX_DISP_MAG is the SAME as the legend max

I have a real problem with MAX_DISP_Y.
It is clear, by observation, that the MAX_DISP_Y is ZERO. All other locations in the model have NEGATIVE (and therefore less) Y
The RPT file reports the MINIMUM as the maximum !?

The MAX_DISP_Z agrees with the RPT file and where there is a choice of positive and negative numbers, the positive number has been chosen.

the CSV file in the results folder agrees with the RPT

As your experience, if I delete the mass and rigid links, agreement between the RPT and results window returns.
Things I haven't tried include creating measures, plotting grid
I will file a call.
- Mark as New
- Bookmark
- Subscribe
- Mute
- Subscribe to RSS Feed
- Permalink
- Notify Moderator
Actually,
Even when the rigid links and mass are removed, the MAX_DISP_Y still shows the MINIMUM Y

So you can follow:
Case Details: 13050900
- Mark as New
- Bookmark
- Subscribe
- Mute
- Subscribe to RSS Feed
- Permalink
- Notify Moderator
Matthew et All,
There are two issues I rather muddled in the call I raised, but the CS chap saw their independence.
ISSUE #1 and original reason for this thread:
The rigid link alters the correspondence between measure values and the values seen in the result windows.
There is something 'funny' going on.
This is now SPR 5694575.
ISSUE #2, of my own making
system measures max_disp_x/y/z reports max ABSOLUTE and not MAX (most positive)
Although I don't use the system 'hardwired' measures other than for indication, finding a MAXIMUM displacement has a MINUS sign could mislead.
These system measures have been reported for decades and I have never, until now, appreciated that they report the largest absolute movement and keep the sign.
The help files describe them as 'maximum WCS displacement over model'
Ambiguous, semantic?
New user beware the true meaning and create your own measures !
I have suggested the names of the measures be changed to be 'max_ABS_disp' and the help text clarified
OR
Actually report the most positive displacement and clarify the help.
To this end it CS suggested that an enhancement request be sought via the community.
... next post a poll to 'Rally your fellow PTC Community members to vote and push your product ideas ...'
I suspect this won't be a 'top product idea'
Rally rally,
ttfn


