Community Tip - Learn all about the Community Ranking System, a fun gamification element of the PTC Community. X
- Community
- Creo+ and Creo Parametric
- Analysis
- How to define real material model?
- Subscribe to RSS Feed
- Mark Topic as New
- Mark Topic as Read
- Float this Topic for Current User
- Bookmark
- Subscribe
- Mute
- Printer Friendly Page
How to define real material model?
- Mark as New
- Bookmark
- Subscribe
- Mute
- Subscribe to RSS Feed
- Permalink
- Notify Moderator
How to define real material model?
Dear Simulate Users,
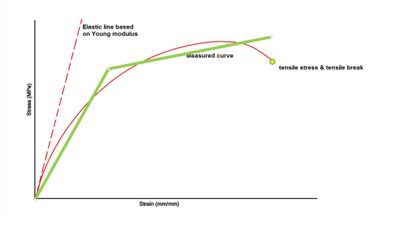
I have the real material model of a plastic (PA66 GF15). A table - send by manufacturer - includes the Young modulus, the max.tensile strain, the max. tensile stress and finally the measured material curve:
The dashed line (see elastic line) was created by Young modulus. It can be seen that the linear range of real curve is very short. The real curve begins to bend quite early. Theoretically the yield point is in the point of bending start.
1. But how can I define a material curve which approximates this real curve well?
2. Where is the yield pont exactly if the data table doesn't include it?
Thanks a lot;
Roland
- Labels:
-
General
- Mark as New
- Bookmark
- Subscribe
- Mute
- Subscribe to RSS Feed
- Permalink
- Notify Moderator
- Mark as New
- Bookmark
- Subscribe
- Mute
- Subscribe to RSS Feed
- Permalink
- Notify Moderator
- Mark as New
- Bookmark
- Subscribe
- Mute
- Subscribe to RSS Feed
- Permalink
- Notify Moderator
Thank, it seems to me fine. But my real problem is the yield strength. There ara a lot of plastics PA66 GFXX which do not include the yield point because the manufacturer does not define it in the material datasheet.
Generally the break point (strain&stress) and the young modulus are defined.
What can I do in this case?
- Mark as New
- Bookmark
- Subscribe
- Mute
- Subscribe to RSS Feed
- Permalink
- Notify Moderator
See page 3 of this article
http://www.datapointlabs.com/testpaks/news_letters/news71.pdf
Essentially the true "yield" point is never provided by datasheets or SS curves.
The true yield point is only important if you desire the amount of permanent set (unloading check box in creo)
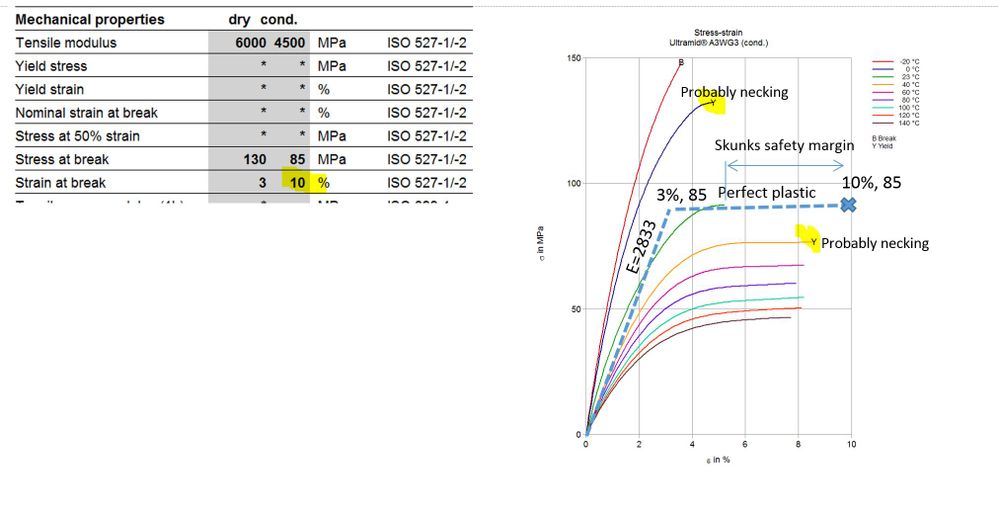
In this case you must do experiments to tune the material model to match results so the next time you can be more correct about permanent set. My initial guess would be yield a little before the necking point. Necking would be the peak of the curve in your case, assuming you are in real stress strain not engineering.
The good news is that often we only care about following the SS curve relatively closely,setting a failure criteria, without caring how much is permanent. In this case you just need to approximate the SS curve as accurately as seems fit. For extremely accurate fitting set the yield according to the 0.2% rule used for metals (that rule is arbitrary too so metals are in a similar problem even if less dramatic). Once the yield point is set by you, the E modulus is adjusted to pass through that point, then curve fitting is used to fit the rest of the curve up to necking. Keep in mind you will not want to include any negative slope on a SS curve.
I often just approximate the curve with a bi-linear approach which is a straight line to some yield point chosen and then either perfect plasticity or hardening slope after that.
Also, temperature is a big factor for plastics like these. The failure criteria can change from brittle failure (use modified mohr) to plastic strain (create a custom measure to track). Also generally the less yielding you allow in the model the more conservative your model is. Yielding tends to relieve stress and thus increase strength. So in other words if you just follow the E, or youngs modulus up to failure stress you will be nicely conservative as far as the material model.
When I do not have the compressive part of the failure I use a rule of thumb for brittle or ductile plastics.
Brittle T/C = 1/2 Ductile T/C = 3/4
http://www.failurecriteria.com/
You might want to cross reference similar PA66 GF material data and curves to make sure there is sense to the data.
My data sources include:
CAMPUS database (I have an offline version)
Total Materia
IDES
Matweb
I hope this helps, I am not in Academia however so these are just my practical, get the job done methods.
- Mark as New
- Bookmark
- Subscribe
- Mute
- Subscribe to RSS Feed
- Permalink
- Notify Moderator
Oh, I failed to mention that it is definitely worth the try to contact the material manufacturer to see if they can recommend a material model for implicit static FEA for your situation. They may only have material cards for some other solver like Nastran or Ansys but those cards could still have the information you need since these types of material definitions are pretty universal.
- Mark as New
- Bookmark
- Subscribe
- Mute
- Subscribe to RSS Feed
- Permalink
- Notify Moderator
- Mark as New
- Bookmark
- Subscribe
- Mute
- Subscribe to RSS Feed
- Permalink
- Notify Moderator
mit freundlichen grüßen
- Mark as New
- Bookmark
- Subscribe
- Mute
- Subscribe to RSS Feed
- Permalink
- Notify Moderator
Great information. However, I would like you to consider this:
Engineering strain increases with stress. So we cannot subtract a constant Eo Engineering strain but instead subtract the actual value of (True stress/Youngs modulus) for each point.
- Mark as New
- Bookmark
- Subscribe
- Mute
- Subscribe to RSS Feed
- Permalink
- Notify Moderator
I don't know if it will answer your question, but other questions about nonlinear properties have been asked before. Here's one that has to do with material properties:Non-linear Material Properties in Creo Simulate
There are probably other inquiries, you just need to search for them.


