Community Tip - New to the community? Learn how to post a question and get help from PTC and industry experts! X
- Community
- Creo+ and Creo Parametric
- Analysis
- Simulation results seem unrealistic compared to re...
- Subscribe to RSS Feed
- Mark Topic as New
- Mark Topic as Read
- Float this Topic for Current User
- Bookmark
- Subscribe
- Mute
- Printer Friendly Page
Simulation results seem unrealistic compared to real test
- Mark as New
- Bookmark
- Subscribe
- Mute
- Subscribe to RSS Feed
- Permalink
- Notify Moderator
Simulation results seem unrealistic compared to real test
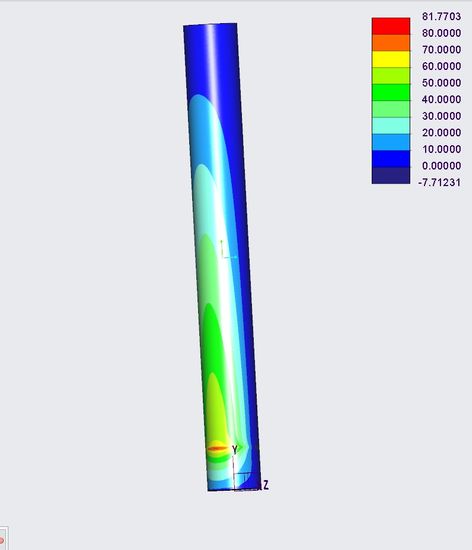
Using a mechanical testing machine I have determined that the bending strength of a hollow circular shaft with brittle material to be about 18 KN at the height of 1.47m. The force was applied perpendicular to the shaft axis at the top end. The attached image shows the simulation setup similar to the real test.
ID and OD of the cross section of the shaft are 0.13m and 0.18 respectively. The breaking stress due to bending has been calculated (momentum/section modulus) as 63 MPa at the critical section where it gets constraint . I have been using this value to compare the results from simulations.
Simulating this bending test in Creo, I find quite different results:
1- Using solid body mesh, the stress is about (Max Principal) 150 MPa at the critical section
2- Simulation Live in Creo Parametric shows Max Principal to be 82 MPa
2- Using mid-surface shell, the max principal is about 108 MPa at the critical section
3- When using shell it is possible to exclude membrane and shear, so the stress due to bending becomes 54 MPa
Here are my questions:
1- Why should we see such high gaps among results from real test, simulkation live, and simulations using shells and or solids?
2- Why the membrane stress is so high (about 57 MPa) in this setting when using shells? (please note the shear stress was quite small and could be neglected and also the mass of the component is 95 Kg)
3- We use the component in a structure that should be tested against shock after finding mode shapes. Surprisingly, when using shell elements it is not possible to exclude membrane after performing the shock study. Is this a software limitation?
A screenshot of the results configuration window for a shock study is attached.
- Labels:
-
Simulate
- Mark as New
- Bookmark
- Subscribe
- Mute
- Subscribe to RSS Feed
- Permalink
- Notify Moderator
- Mark as New
- Bookmark
- Subscribe
- Mute
- Subscribe to RSS Feed
- Permalink
- Notify Moderator
- Mark as New
- Bookmark
- Subscribe
- Mute
- Subscribe to RSS Feed
- Permalink
- Notify Moderator
- Mark as New
- Bookmark
- Subscribe
- Mute
- Subscribe to RSS Feed
- Permalink
- Notify Moderator
Thank you for so much for your comments and providing the example model. I reviewed the model and run it; the result is quite close. I have tried mapped meshing on the entire shaft (not mirrored) but again no success in getting close to the expected result. I am reluctant to use mirror symmetry constraint because the shaft will be used in a larger non-symmetrical assembly where forces from all directions will be acting on the components (a shock study with accelerations on x, y, and z axes, and a static study with forces on x, y, and z directions).
More info: the larger assembly is a vertical structure that includes solid components on both ends of the shaft. The shaft is located in the middle of the structure acting as a pillar. I use structural bolts to mount the bottom component to a plate (acting as ground).
- Mark as New
- Bookmark
- Subscribe
- Mute
- Subscribe to RSS Feed
- Permalink
- Notify Moderator
"... I use structural bolts to mount the bottom component to a plate (acting as ground). ..." not relevant
please observe measures!
3D-example att.
- Mark as New
- Bookmark
- Subscribe
- Mute
- Subscribe to RSS Feed
- Permalink
- Notify Moderator
Thank you again for your reply. Could you please take a look at the attached assembly and help me find the reason(s) why I couldn't achieve 63 MPa at the critical section?
I know it creates singularities at the edge and I have tried different tricks such as creating volume and surface regions, etc. but no luck. Only creating top surface shell gave me 63 Mpa, but I wouldn't trust it.
Based on some instructions, I usually use a plate at the bottom of the assembly and constraint the bottom surface of the plate in order to search for resonant frequencies and subsequently perform a shock study. Using "Spring to ground" feature in the model you provided was very interesting. I haven't seen any useful reads about the feature on PTC web support. Are you aware of any good online resources about this feature?
- Mark as New
- Bookmark
- Subscribe
- Mute
- Subscribe to RSS Feed
- Permalink
- Notify Moderator
sorry, you use creo 6,
my release is creo 2 m080.
- Mark as New
- Bookmark
- Subscribe
- Mute
- Subscribe to RSS Feed
- Permalink
- Notify Moderator
- Mark as New
- Bookmark
- Subscribe
- Mute
- Subscribe to RSS Feed
- Permalink
- Notify Moderator
what is the middle part?
- Mark as New
- Bookmark
- Subscribe
- Mute
- Subscribe to RSS Feed
- Permalink
- Notify Moderator
in reality, it is a glue-like paste that we feed in to mount the tube to the support. It becomes solid after curing for some time. Poisson ratio 0.2, and Young's modulus: 21.5 GPa
- Mark as New
- Bookmark
- Subscribe
- Mute
- Subscribe to RSS Feed
- Permalink
- Notify Moderator
Hi,
i think, Your design is not ok.
My test att. (design_new.zip)
- Mark as New
- Bookmark
- Subscribe
- Mute
- Subscribe to RSS Feed
- Permalink
- Notify Moderator
Hi, thanks again for working on this and providing your feedback. The design that I provided previously was very similar to the real setup. I checked your design and run it; although there were some changes to the geometry still it shows 82 Mpa.
Using the original design, I get about 63 Mpa when using a paired shell for tube and placing it on top (outer surface). I was hoping to obtain this when using the middle surface but it brings higher values, so the question is how rational is it to use a top surface shell?
Here is what I did::
1- Tube material: Poisson ratio: 0.17, Young's Modulus: 110 GPa
2- Using a paired shell for tube and placing it on the top (outer) surface. "Extend adjacent surface" checked.
3- Creating rigid links between bottom surfaces of the tube and the middle piece
3- Limiting max element size to 20mm for the middle piece and support
- Mark as New
- Bookmark
- Subscribe
- Mute
- Subscribe to RSS Feed
- Permalink
- Notify Moderator
- Mark as New
- Bookmark
- Subscribe
- Mute
- Subscribe to RSS Feed
- Permalink
- Notify Moderator
Thanks again. It should be noted that the challenge is to obtain the calculated stress by simulating the real design/test and not to make any changes to the design.
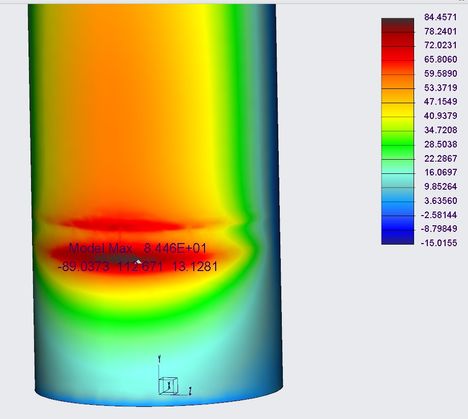
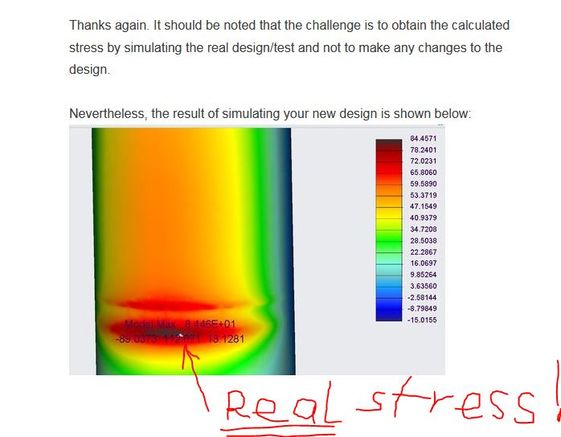
Nevertheless, the result of simulating your new design is shown below:
- Mark as New
- Bookmark
- Subscribe
- Mute
- Subscribe to RSS Feed
- Permalink
- Notify Moderator
It may be that the inside corner of the ceramic mortar is crushing and thus the stress concentration is relieved somewhat before the tube fails. So the mortar failure propagation may come into play. You may need some interpretation, approximation, or adjustment method to correct for that.
Also, how about testing the tube as a simply supported beam to see if you still get 63MPa as the theoretical stress? That might reduce the boundary condition issues because the failure should be in the center of the tube, not at the end constraints. If by chance then you find it fails at a higher stress than 63MPa you can then compare and adjust the FEA modelling technique appropriately.
Once you prove that you do not have a singularity, or are able to overlook it, you should be able to rely on the reported stresses from Creo. I am still working on something to show the singularity more clearly and how the 63MPa is underlying the result.
- Mark as New
- Bookmark
- Subscribe
- Mute
- Subscribe to RSS Feed
- Permalink
- Notify Moderator
Ok, so for this study I am looking at stress along the curve shown (green)
I ran multiple times where I varied the element order from 2nd order to 6th order.
1470mm along the curve is where the support starts and the support and singularity occurs.
Note how the generally linear portion of the stress along the curve could be extrapolated to intersect at about (1470mm, 63MPa). This is the theoretical stress if there is no singularity or boundary condition influences.
However we see a spike in stress at exactly 1470mm and it keeps going up with higher order elements as seen when we zoom in on the plot. This is exactly what a singularity does. The more elements / higher order elements are used, the higher the stress goes. This follows the theory for stress concentration factors since the radius is zero the stress is infinite.


- Mark as New
- Bookmark
- Subscribe
- Mute
- Subscribe to RSS Feed
- Permalink
- Notify Moderator
Thank you for the detailed analysis. It is interesting that results are very close at 1467 using any order of elements and how using higher order elements causes a spike. Looking at the plot theoretically, what could be the reason for a fall in the curve in the region highlighted in the graph below.
Next, lets talk about practical use of the results and look at the issue from this perspective. On one hand, I have the max bending force of the tube from a real test that I must use to provide the safety factor for using the the tube in other assemblies. On the other hand, I am using Creo simulations to study stresses in such assemblies (i.e. a new structure that uses the tube in its structure and has a very similar support for tube at the bottom section) in order to report the max stress acting on the tube.
When preparing reports, I have to provide the bending test report and use the value from bending test in order to calculate the safety factor. If the simulation of the bending test of the tube itself using Creo Simulate shows 84 MPa whereas the calculated (nominal) value is 63 MPa, how should I proceed? Is using a fudge factor (=84/63=1.33) recommended?
As an example, simulation of a new assembly shows that all combination of forces cause a stress of 22 MPa on the tube. Should I assume that the comparable value must be 22 divided by 1.33?
New stress value = 22/1.33 = 16.54
Safety factor: 63/16.54 = 3.8
- Mark as New
- Bookmark
- Subscribe
- Mute
- Subscribe to RSS Feed
- Permalink
- Notify Moderator
The problem is that you are not doing the physical test with a standard 3 point bending test. The 63MPa has no meaning and is not the theoretical strength if there is any stress concentration during the physical test. The three point bending setup is designed to minimize the risk of stress concentrations, that is why they are not done as cantilever beams. Once you have determined the real strength of the material using this type of test, you will need to compare your FEA stress to it, and also you can reverse-engineer the stress concentration factor to use for your design with that sharp corner. The stress concentration factor will be the empirical number used only if the same corner condition is occurring. The stress in any other (non stress concentration or singularity) areas will be compared to the 3 point bending strength. (without applying an empirically found concentration factor).
Example:
3 point bending determines strength of material is 120MPa.
Baseline FEA with nominal 60MPa stress, ignoring the spike at the singularity, assuming 2.0 stress concentration factor = 120MPa. Correlation model established. (the concentration factor is adjusted to make the final stress match 3 point bending)
A new design exhibits 30MPa stress not near a singularity and 25MPa near a singularity. The 25MPa was found by smoothing/ignoring the spike in a corner situation very like the baseline FEA. So for the 30MPa location the safety factor is 120MPa/30MPa=4.0. For the 25MPa location the 25MPa is multiplied by concetration factor of 2.0 to be 50MPa which gives a safety factor of 120MPa/50MPa = 2.4. But this also is 60MPa/25MPa=2.4 so the nominal stress can also be compared, but ONLY if the concentration factor (singularity situation) is expected to act the same!
Further discussion: Since your physical test as a cantilever beam, includes the singularity, the stress concentration factor cannot be separated out. Only stresses under the same condition, being at a similar stress concentration area, can be compared. Areas not near such conditions would accept higher stresses to failure, but that could be determined with 3 point bending test, that removes the concentration factor.
Finally: I think the reason the nominal stress dips in the chart near the attachment area is because of stress flow. The stress and strain is flowing inward to "prepare" for the sharp corner, kind of like a race car driver edging away from a corner before taking it. Also, the support structure is eventually helping to provide a lower stress and so the stress condition needs to begin conforming to the lower stresses at the support structure.

- Mark as New
- Bookmark
- Subscribe
- Mute
- Subscribe to RSS Feed
- Permalink
- Notify Moderator
Thank you so much for the explanations. Although not the standard 3-point bending test, the type of bending test that we do is set by a standard and is being commonly used in the industry that I work for.
Do you have any insights why there are huge gaps between FEA results when using solid elements vs. shell elements for the tube given the external force condition? Also, when using paired shell and placing it on outer surface of the tube instead of mid-plane, I get results similar to calculations. From an online article: thin shells do not consider the stress in the direction perpendicular to the shell surface, but thick shells can consider stresses through the thickness on the shell, in the direction normal to the middle surface, and account for shear deformation. (source Linkedin).
- Mark as New
- Bookmark
- Subscribe
- Mute
- Subscribe to RSS Feed
- Permalink
- Notify Moderator
"... Also, when using paired shell and placing it on outer surface of the tube instead of mid-plane, I get results similar to calculations. ..."
this is not admissible when pipe is bigger
- Mark as New
- Bookmark
- Subscribe
- Mute
- Subscribe to RSS Feed
- Permalink
- Notify Moderator
- Mark as New
- Bookmark
- Subscribe
- Mute
- Subscribe to RSS Feed
- Permalink
- Notify Moderator
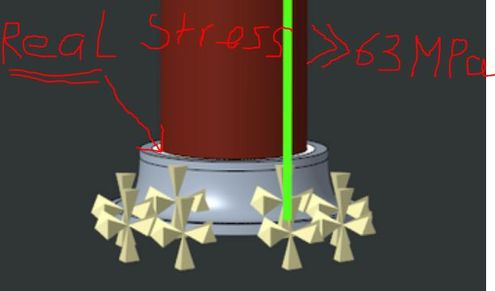
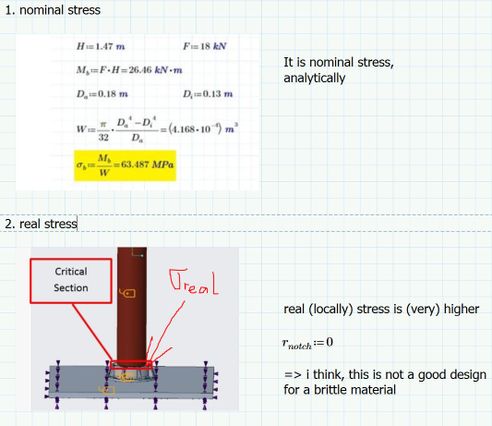
OK, once again: 63 MPa is NOT REAL STRESS (locally), but analytically (nominally)
85 MPA is REAL STRESS in the modified design.
But in your design is real stress not 63 MPA, but >>63 MPa, maybe 100 MPA or more, OK?
- Mark as New
- Bookmark
- Subscribe
- Mute
- Subscribe to RSS Feed
- Permalink
- Notify Moderator
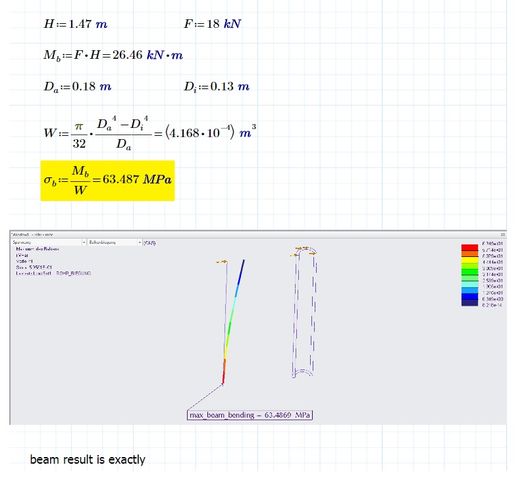
Is your 63MPa hand calculated based on beam theory stress for a hollow tube in bending?
Has the tube material been tested for its ultimate tensile strength value, using standard ISO/ASTM method and what is that?
Quiz: What could be the reason the tube only model has a weighted link and spring to ground, whereas the model with the support has a full constraint? (please give your thoughts and then one of us will answer)
Skunks added a chamfer to the model which is what I think is meant by "design is not ok" The chamfer helps reduce numerical difficulties (singularity) with a 90 degree inside corner making it a 45 degree inside corner.
- Mark as New
- Bookmark
- Subscribe
- Mute
- Subscribe to RSS Feed
- Permalink
- Notify Moderator
Yes, 63 MPa is calculated based on beam theory stress for hollow tube in bending. see the calculations below provided by Skunks. The tube is made from a brittle material and the reason for the breaking test is to identify its strength due to manufacturing quality concerns. Here is the material properties set by the standard: https://bit.ly/2RBkmQN
Quiz answer: I tried constraining the tube bottom surface myself; it causes singularities at the edges of that surface and creates a high-stress area. Spring to the ground was Skunk idea and it worked quite well. I usually use a plate at the bottom of the setup and constraint the bottom surface of the plate.
- Mark as New
- Bookmark
- Subscribe
- Mute
- Subscribe to RSS Feed
- Permalink
- Notify Moderator
Thank you, that clears things up a lot for me.
As far as the quiz... The tube only study has its critical stress right at the boundary condition. According to St Venants principle as long as you are sufficiently away from the boundary condition the stress is correct and it does not matter if a singularity or other issue is present at the BC. The problem with a full constraint is that is holds more than just in plane, it also holds "poissons ratio related changes" The hand calculations do not have the same boundary condition, being held just in plane. What the weighted link does is release this overconstraint. In the full model since the constraint is a ways away from the critical stress area, the constraint is no longer affecting the critical stress value. By using your plate method you also are getting the constraint away from the critical stress area, but it is still a little close, depending on plate thickness. In your full model with the support, the constraint is far enough away from the critical stress area to not require the weighted link method.
I am working on hopefully explaining why you will not get 63MPa at the critical section for the full model vs hand calculation and tube-only model which agree. more to come...
- Mark as New
- Bookmark
- Subscribe
- Mute
- Subscribe to RSS Feed
- Permalink
- Notify Moderator
Thank you for the information. Eagerly waiting to receive your explanation.
- Mark as New
- Bookmark
- Subscribe
- Mute
- Subscribe to RSS Feed
- Permalink
- Notify Moderator
maybe it's not simple...
- Mark as New
- Bookmark
- Subscribe
- Mute
- Subscribe to RSS Feed
- Permalink
- Notify Moderator
You might be right but this type of design has been out there for a long time and has become standard within the industry that I work for.
Referring to my first post here outlining the issue, the important question is why PTC simulate shows such a high membrane stress whereas the external force is acting in a perpendicular direction to the tube axis.
From hand calculations, shear and normal stresses are almost nothing compared to the bending stress. (Tube mass: 95 Kg)


