
Turn on suggestions
Auto-suggest helps you quickly narrow down your search results by suggesting possible matches as you type.
Showing results for
Please log in to access translation
Turn on suggestions
Auto-suggest helps you quickly narrow down your search results by suggesting possible matches as you type.
Showing results for
Community Tip - New to the community? Learn how to post a question and get help from PTC and industry experts! X
- Community
- Creo+ and Creo Parametric
- Customization
- Re: How to debug an application created with help ...
Translate the entire conversation x
Please log in to access translation
Options
- Subscribe to RSS Feed
- Mark Topic as New
- Mark Topic as Read
- Float this Topic for Current User
- Bookmark
- Subscribe
- Mute
- Printer Friendly Page
How to debug an application created with help of Object Toolkit C++
Apr 29, 2016
09:25 AM
- Mark as New
- Bookmark
- Subscribe
- Mute
- Subscribe to RSS Feed
- Permalink
- Notify Moderator
Please log in to access translation
Apr 29, 2016
09:25 AM
How to debug an application created with help of Object Toolkit C++
Hello!
I'm trying to develop some application using object toolkit(from parametric 3.0) via c++.
Started from the building of async examples. I did read in the User Guide, that it's better to perform developing in async mode due to ability to debug your application.
I faced two problems:
1. program was terminated on line: connection = pfcAsyncConnection::Start(creo_cmd, text_path);
I'm using Visual Studio 2012. sync examples were executed OK.
I added following to "Debugging > Command Arguments > "$(PRO_COMM_MSG_EXE)\pro_comm_msg.exe" .text\"
I'm not sure it was a right decision, but I couldn't find any valid description of the process of executing an application in async mode, so just had to experiment 
At this point, it would be great to debug my program and find out an exception or some other additional info.
It's time to point #2.
2. There are no debugging symbols for object toolkit libs.
Where can I find it?
Thank you in advance,
Artem
Solved! Go to Solution.
Labels:
- Labels:
-
General
ACCEPTED SOLUTION
Accepted Solutions
May 04, 2016
09:39 AM
- Mark as New
- Bookmark
- Subscribe
- Mute
- Subscribe to RSS Feed
- Permalink
- Notify Moderator
Please log in to access translation
May 04, 2016
09:39 AM
Artem -
I don't know exactly why you can't attach your debugger, but I suspect that your code was not compiled for debugging. In Visual Studio, I typically have two configurations for each project: Debug and Release. Most of the time, I build and test the Debug configuration. When I'm ready to let my end users test the code, I build them a copy using the Release configuration, which does not have the extra data needed for debugging. This is a typical work pattern in Visual Studio.
My first suggestion is that you check to see whether you are testing a Debug or Release build:
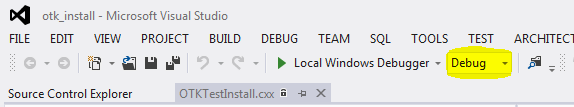
Keep in mind that Visual Studio typically writes the Debug and Release output in different folders, so you also need to edit your .dat file entries accordingly.
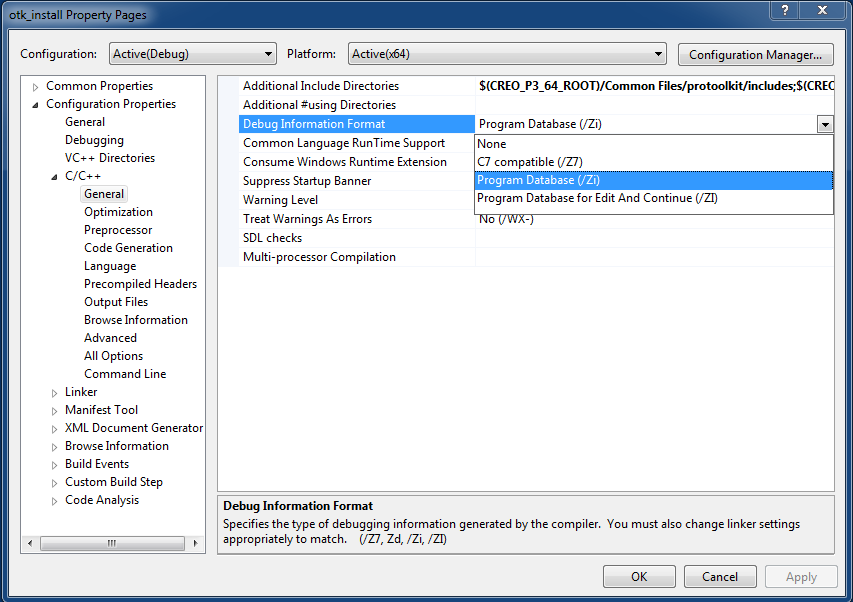
If you are building in the Debug configuration and you still can't attach the debugger, check to see that your are actually compiling your code for debugging:
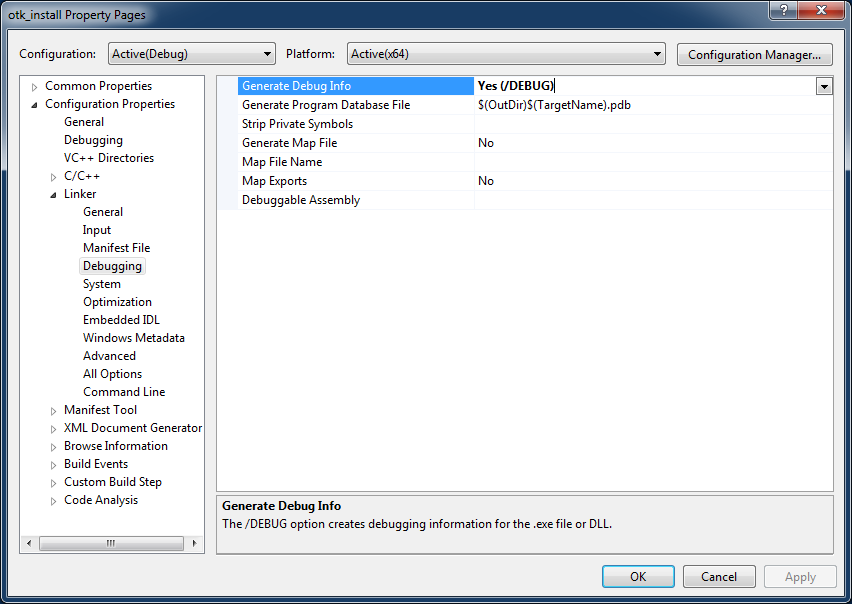
You will also need to check your linker options:
I hope this helps.
|+| M a r k |+|
6 REPLIES 6
May 02, 2016
12:39 PM
- Mark as New
- Bookmark
- Subscribe
- Mute
- Subscribe to RSS Feed
- Permalink
- Notify Moderator
Please log in to access translation
May 02, 2016
12:39 PM
Hi Artem -
There are several things I'd like to mention in response to your post.
Started from the building of async examples. I did read in the User Guide, that it's better to perform developing in async mode due to ability to debug your application.
I use Creo Parametric Toolkit (Pro/Toolkit) much more than OTK C++, so I checked the OTK User Guide to see what it says about debugging. It recommends Synchronous Multiprocess (.exe) mode to test and debug programs that you ultimately plan to run in Synchronous DLL mode. Here's a quote from page 22 of the user guide PDF:
Multiprocess mode involves more communications overhead than DLL mode, especially when the PTC Creo Object TOOLKIT C++ application makes frequent calls to PTC Creo Object TOOLKIT C++ library functions, because of the more complex method of implementing those calls. However, it offers the following advantage: it enables you to run the PTC Creo Object TOOLKIT C++ application with a source-code debugger without also loading the whole PTC Creo executable into the debugger.
Synchronous Multiprocess mode is not the same as Asynchronous mode. In Synchronous Multiprocess and DLL modes, the program runs "inside" the Creo Parametric session, usually from ribbon UI or other menu selection. In Asynchronous mode, your program starts by itself and either launches a new Creo Parametric session or connects to an existing one. In other words, synchronous mode means that Creo runs your program, and asynchronous mode means your program runs Creo.
It sounds like, for now you're working on an asynchronous example.
I faced two problems:
1. program was terminated on line: connection = pfcAsyncConnection::Start(creo_cmd, text_path);
I'm using Visual Studio 2012. sync examples were executed OK.
I added following to "Debugging > Command Arguments > "$(PRO_COMM_MSG_EXE)\pro_comm_msg.exe" .text\"
I'm not sure it was a right decision, but I couldn't find any valid description of the process of executing an application in async mode, so just had to experiment
I don't know why you use those values as your command arguments. Would you type those values if you ran your program from the "C:\>" prompt? If your program does not need command-line arguments, then you should leave Debugging > Command Arguments blank.
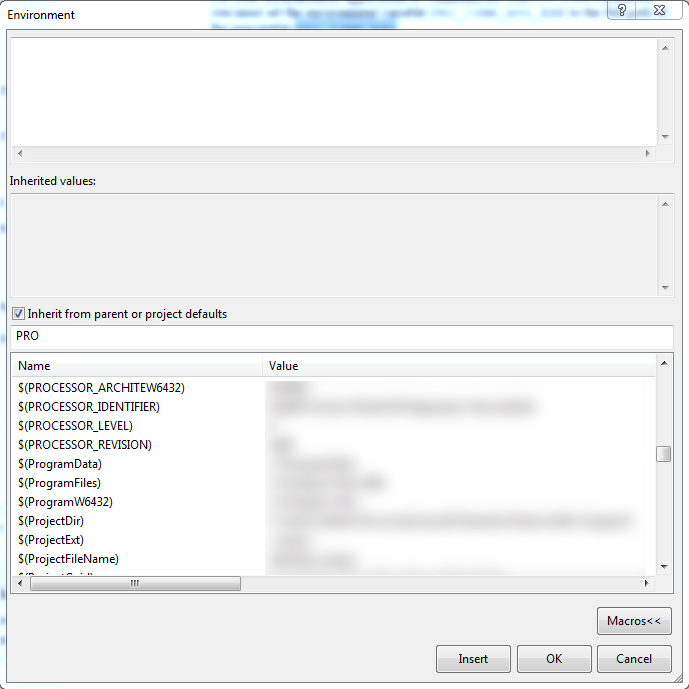
You do need $(PRO_COMM_EXE) in your environment, and there are at least two ways you can set it:
- Create the PRO_COMM_EXE environment variable in the System Control Panel.
- Set it in Visual Studio under Debugging > Environment. When you edit this field, click the Macros button to see whether $(PRO_COMM_EXE) is already defined:
At this point, it would be great to debug my program and find out an exception or some other additional info.
It's time to point #2.
2. There are no debugging symbols for object toolkit libs.
Where can I find it?
Unless I'm misunderstanding something, PTC doesn't provide debugging data for its toolkits, and you shouldn't need them.
I hope this helps - good luck!
|+| M a r k |+|
May 03, 2016
03:43 PM
- Mark as New
- Bookmark
- Subscribe
- Mute
- Subscribe to RSS Feed
- Permalink
- Notify Moderator
Please log in to access translation
May 03, 2016
03:43 PM
Hi Artem,
Debugging a synchronous dll is what I always do. You can visit the following URL which contains a PDF. This PDF contains instructions on how to use Visual Studio and attach it to Creo to debug a dll.
May 04, 2016
09:13 AM
- Mark as New
- Bookmark
- Subscribe
- Mute
- Subscribe to RSS Feed
- Permalink
- Notify Moderator
Please log in to access translation
May 04, 2016
09:13 AM
Hi Mark, Patrick,
Thanks for your help.
Now I realized, I don't need async mode to debug. I switched to a synchronous Multiprocess mode.
I can attach debugger from Visual Studio to the process of my application. That's nice!
Nevertheless, I can't use debug features(breakpoints, step in, step over etc) with my application.
I got an exception executing my app. But I can't use debugger to find it, it says: 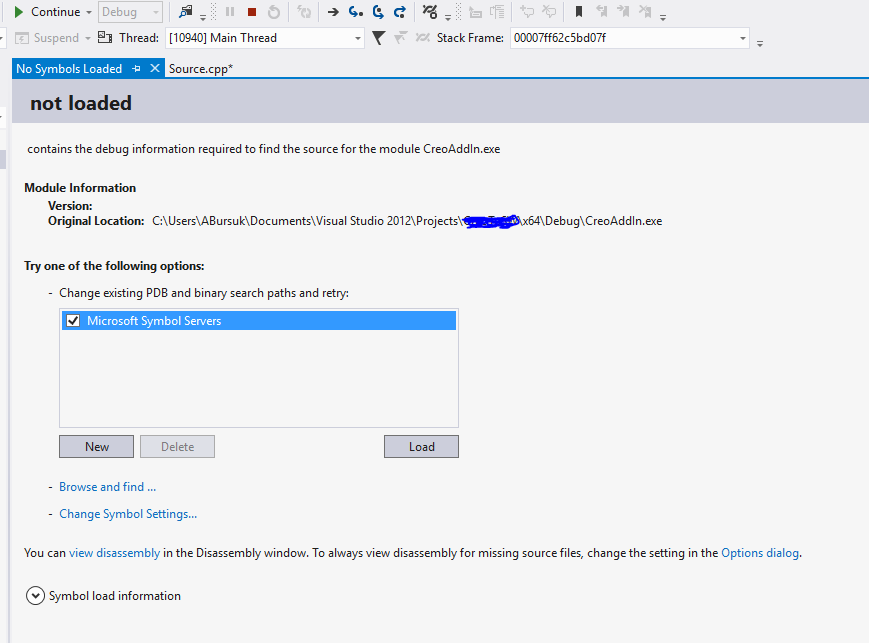
I have to put several std::cout calls to understand where exception appears. It's annoying.
Here is my code(I'm trying to get geometry from a part): [C++] tst - Pastebin.com
PS:
Patrick, thanks for the link, I left registration request there to get an access to the PDF file.
May 04, 2016
09:39 AM
- Mark as New
- Bookmark
- Subscribe
- Mute
- Subscribe to RSS Feed
- Permalink
- Notify Moderator
Please log in to access translation
May 04, 2016
09:39 AM
Artem -
I don't know exactly why you can't attach your debugger, but I suspect that your code was not compiled for debugging. In Visual Studio, I typically have two configurations for each project: Debug and Release. Most of the time, I build and test the Debug configuration. When I'm ready to let my end users test the code, I build them a copy using the Release configuration, which does not have the extra data needed for debugging. This is a typical work pattern in Visual Studio.
My first suggestion is that you check to see whether you are testing a Debug or Release build:
Keep in mind that Visual Studio typically writes the Debug and Release output in different folders, so you also need to edit your .dat file entries accordingly.
If you are building in the Debug configuration and you still can't attach the debugger, check to see that your are actually compiling your code for debugging:
You will also need to check your linker options:
I hope this helps.
|+| M a r k |+|
May 04, 2016
09:52 AM
- Mark as New
- Bookmark
- Subscribe
- Mute
- Subscribe to RSS Feed
- Permalink
- Notify Moderator
Please log in to access translation
May 04, 2016
09:52 AM
Thanks, Mark!
I had both options with incorrect values.
Now it works perfectly fine!
Mar 27, 2018
01:33 PM
- Mark as New
- Bookmark
- Subscribe
- Mute
- Subscribe to RSS Feed
- Permalink
- Notify Moderator
Please log in to access translation
Mar 27, 2018
01:33 PM
Mark,
I'm trying to debug the protoolkit example called pt_async. It has a make file. I can build it and create pt_async.exe. But it fails during run so I want to debug it. If I right-click on make_async in the Solution Explorer of VS2015 and select Properties, I get only 4 options under Configuration Properties - General, Debugging, VC++ Directories, and NMake. I do not have the C/C++ or Linker options that you identify. What to do in this case?
Thank you,
Greg
Announcements


Top Tags
