Engine Failure-Prediction GUI
- November 7, 2022
- 0 replies
- 774 views
- GUIDE CONCEPT
- Step 1: Scenario
- Step 2: Create Mashup
- Step 3: Add Widgets
- Step 4: Add Data
- Step 5: Bind Data
- Step 6: View Mashup
- Step 7: Next Steps
Create an Engine Failure Prediction GUI to warn about customer issues.
GUIDE CONCEPT
This guide will use ThingWorx Foundation's Mashup Builder to create a Graphical User Interface (GUI) to display results from Analytics Manager comparisons of your analytical model to real-time data.
Following the steps in this guide, you will learn how to utilize Widgets and backend data to quickly visualize customer failure conditions.

YOU'LL LEARN HOW TO
- Create a Mashup
- Add Widgets to represent different data
- Bring Backend Data into the Mashup
- Tie data to Widgets
- View Analytical Results in a convenient GUI
NOTE: The estimated time to complete all parts of this guide is 30 minutes.
Step 1: Scenario
In this guide, we're finishing up with the MotorCo scenario where an engine can fail catastrophically in a low-grease condition.
In previous guides, you've gathered and exported engine vibration-data from an Edge MicroServer (EMS) and used it to build an engine analytics model. You've even put that analytical model into service to give near-immediate results from current engine-vibration readings.
The goal of this guide is to create a GUI to visualize those predicted "low grease" conditions to facilitate customer warnings.

GUI-creation to visualize analytical model deployment can be extremely helpful for the automative segment in particular. For instance, each car that comes off the factory line could have an EMS constantly sending data from which an analytical model could automatically detect engine trouble.
This could enable your company to offer an engine monitoring subscription service to your customers.
This guide will show you how to visualize the results of an engine analytic model for a "smart, connected products" play.
Step 2: Create Mashup
Mashups are ThingWorx Foundation's method of creating Graphical User Interfaces (GUIs).
Mashups are created through the Mashup Builder interface.
Before you can use this drag-and-drop interface, you must first create a new Mashup.
1. In ThingWorx Foundation Composer, click Browse > Visualization > Mashups.
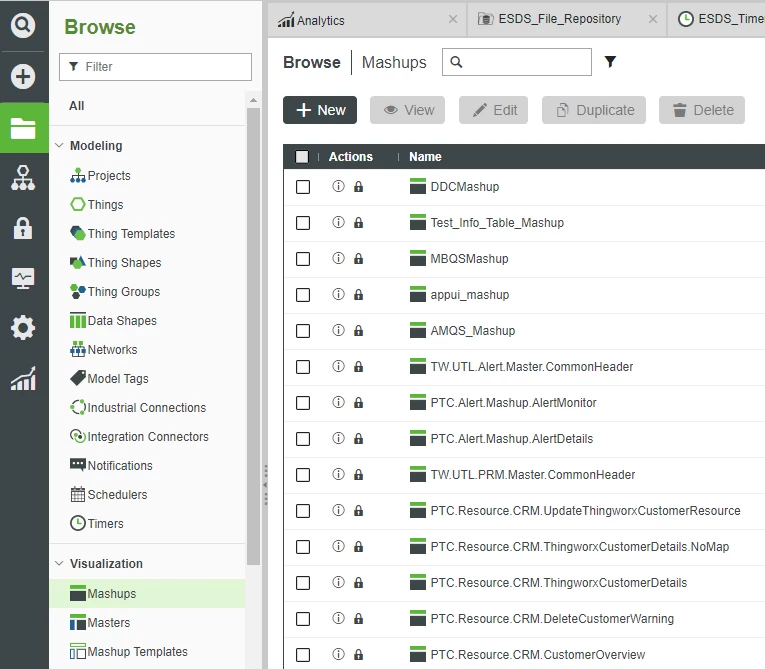
2. Click + New.
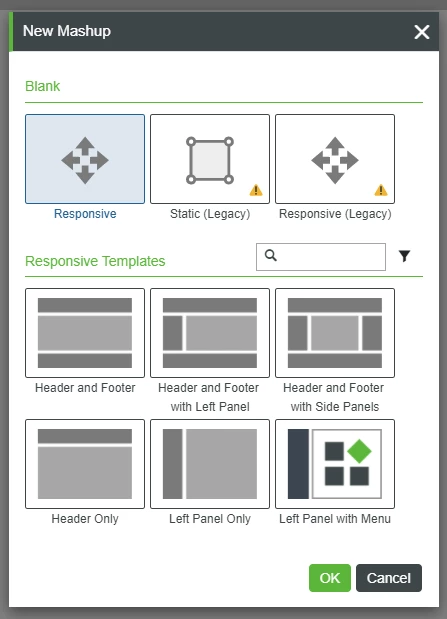
3. Leave the defaults and click OK.
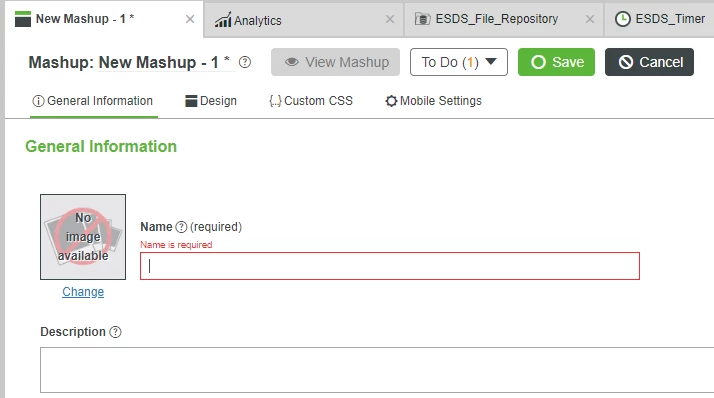
4. In the Name field, type EFPG_Mashup.
5. If Project is not already set, search for and select PTCDefaultProject.
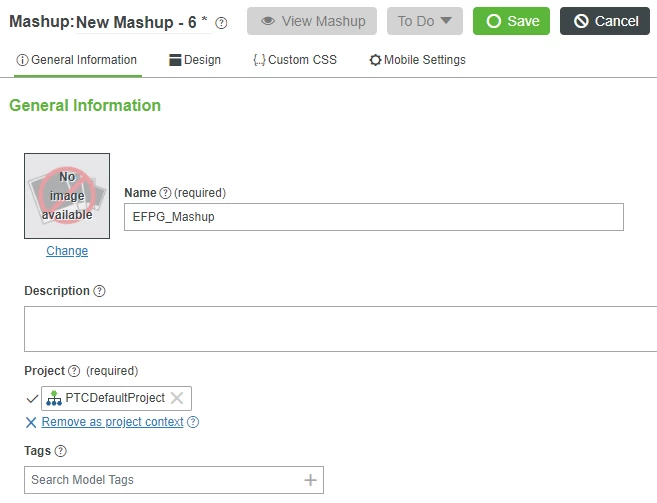
6. At the top, click Save.
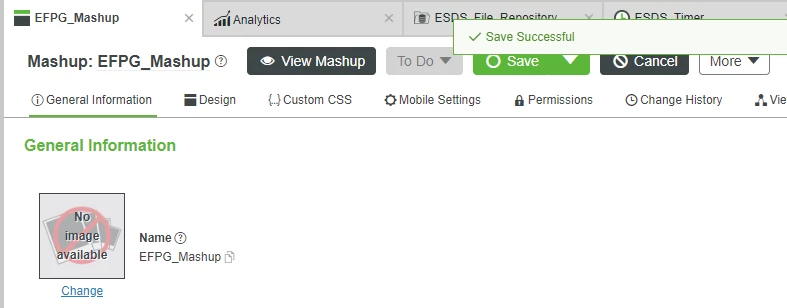
7. At the top, click Design.
- You are now in the Mashup Builder interface, where you can drag-and-drop graphical elements (Widgets) to create your GUI.
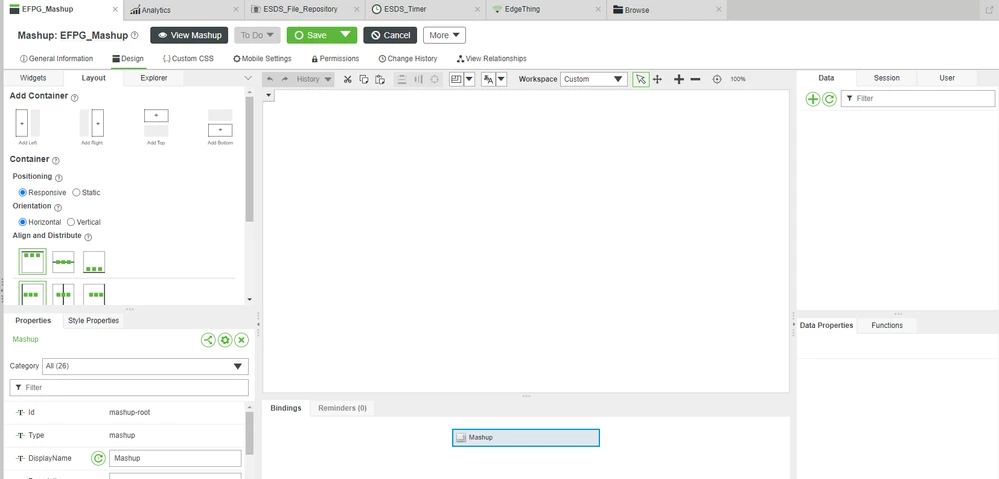
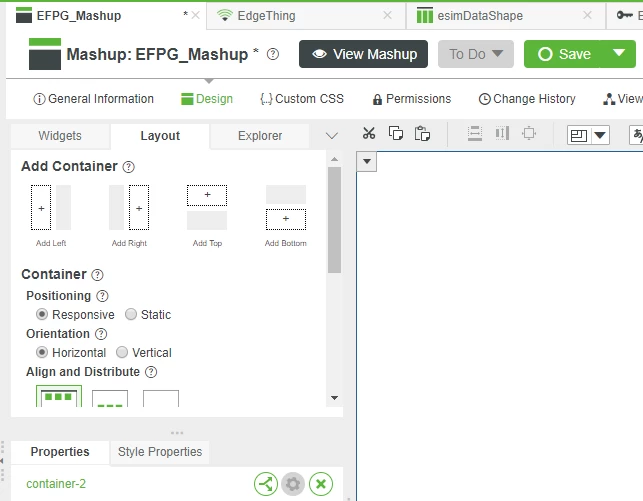
8. At the top-left, click the Layout tab.
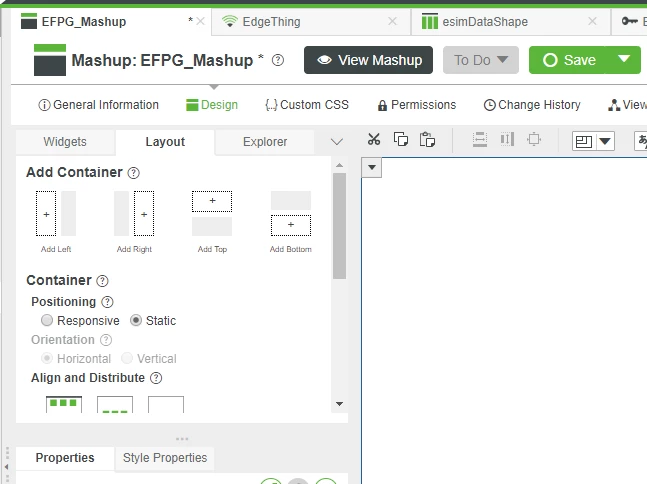
9. Change Positioning to Static.
- This removes any auto-positioning or dynamic-sizing from our Mashup, so that we can place and size Widgets manually.
10. At the top, click Save again.
Step 3: Add Widgets
We now want to add several Widgets to our Mashup by dragging-and-dropping them into the central Canvas area.
- Return to the Widgets tab in the top-left.
2. In the Filter Widgets field, type label.
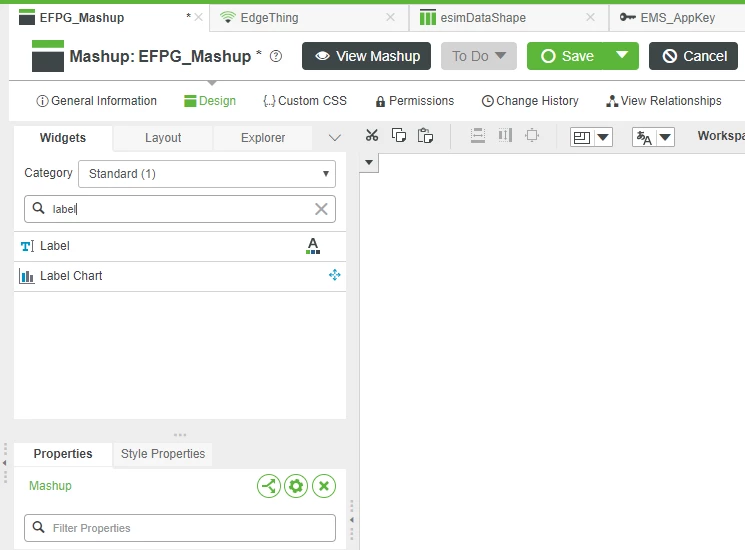
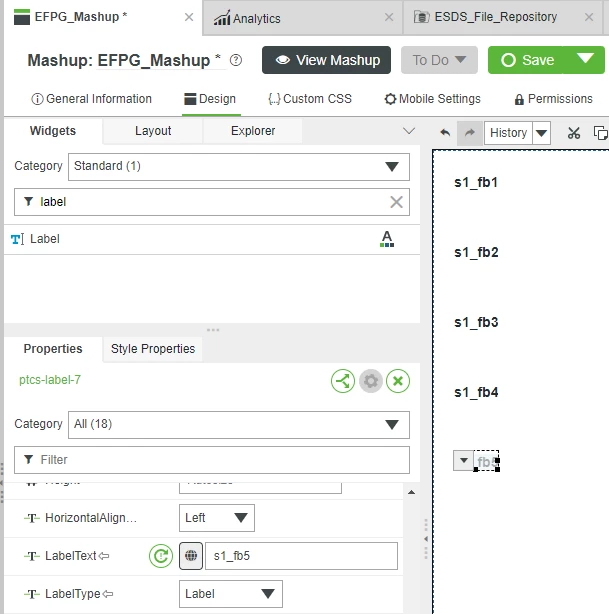
3. Drag-and-drop five (5) Label Widgets onto the central Canvas area.
4. Select the Label Widgets, go to the Properties in the bottom-left, and change the Label's LabelText to s1_fb1 through s1_fb5.
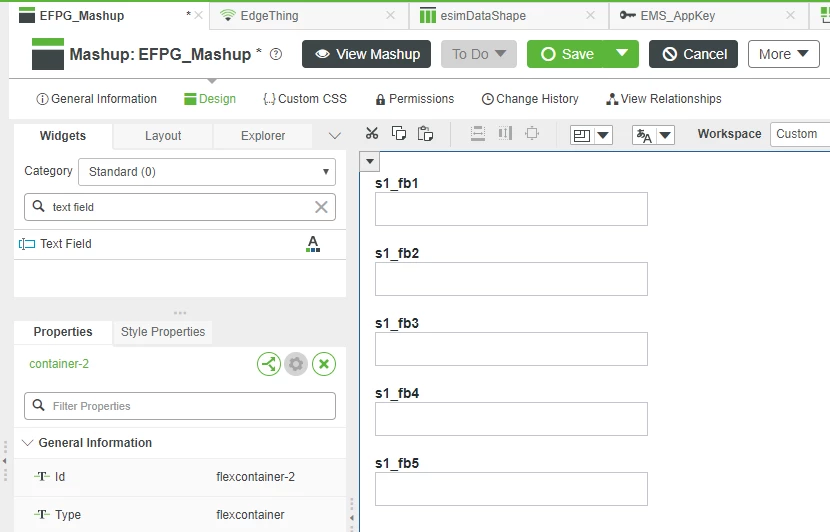
5. Filter Widgets for text field, and then drag-and-drop five (5) Text Field Widgets onto the central Canvas area.
6. Drag-and-drop two (2) more Label Widgets onto the central Canvas area.
7. Change their LabelText Properties to Result_low_grease and Result_low_grease_mo.
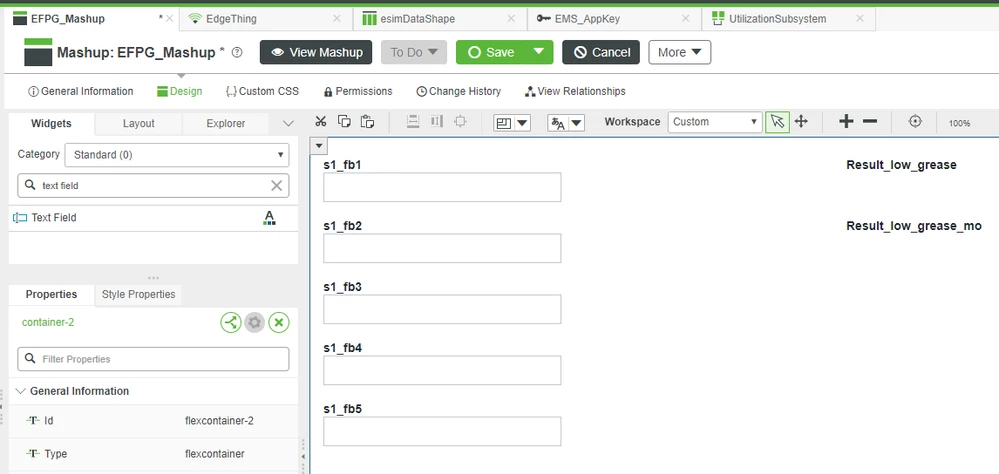
8. Drag-and-drop two (2) more Text Field Widgets onto the central Canvas area.
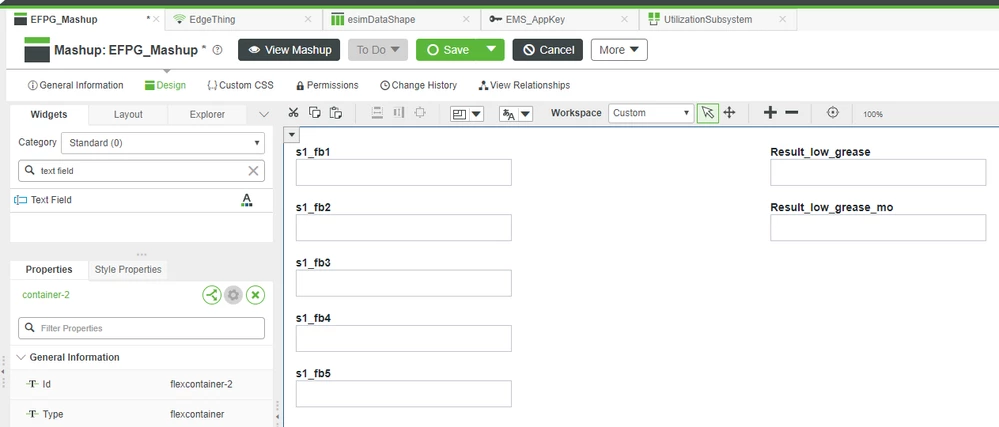
9. In the top-left Widget's tab, change Category to Legacy.
10. Drag-and-drop an Auto Refresh Widget onto the Canvas.
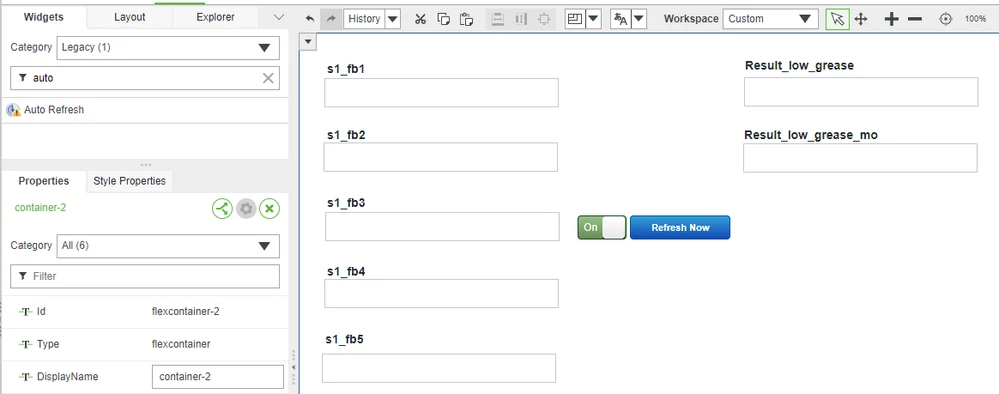
11. At the top, click Save.
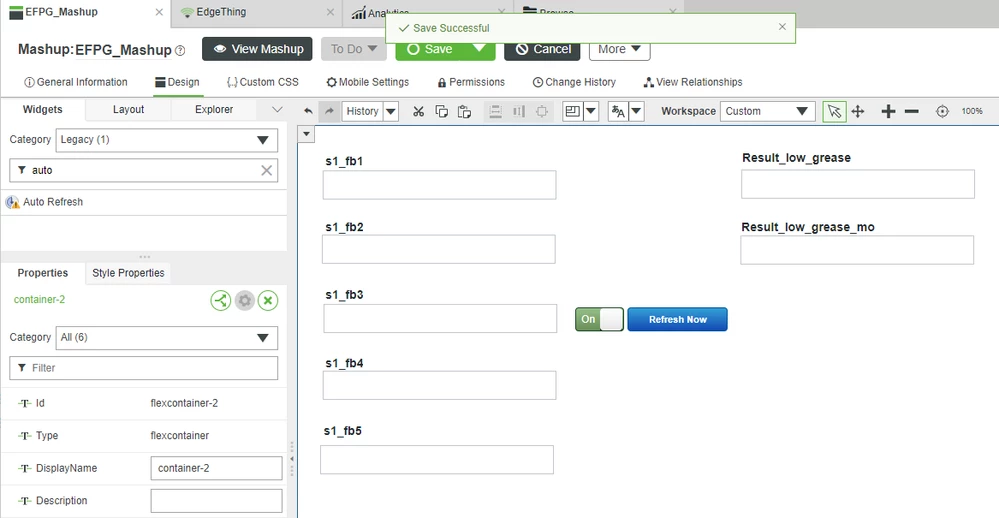
Step 4: Add Data
Now that we have a rough set of Widgets in place to display Data in our Mashup, we need to bring in backend Data from Composer.
1. In the top-right, ensure the Data tab is active.

2. Click the green + button.
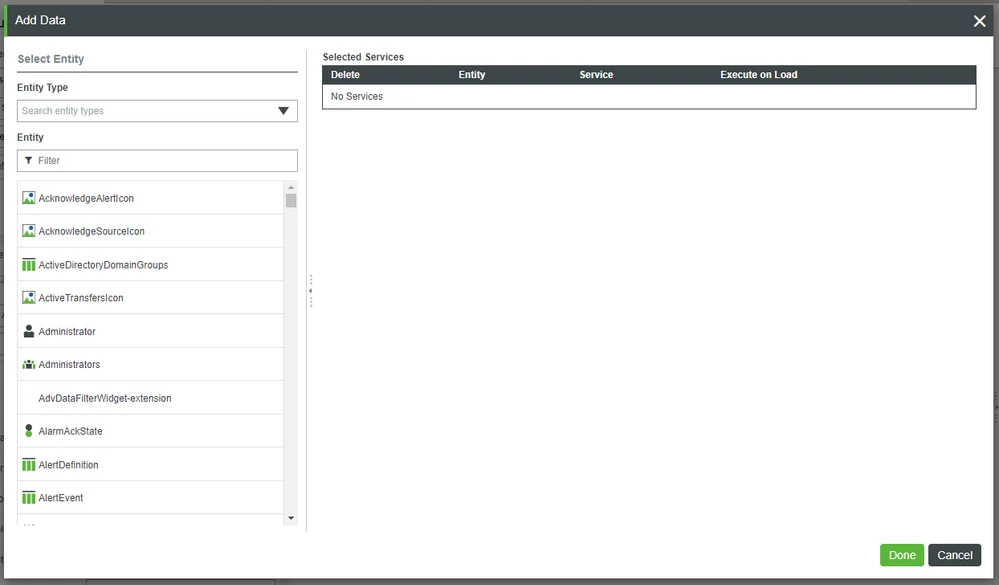
3. In the Entity Filter field, search for and select EdgeThing.
4. In the Services Filter field, type getprop.
5. Click the right-arrow beside GetProperties.
6. On the right, check Execute on Load.
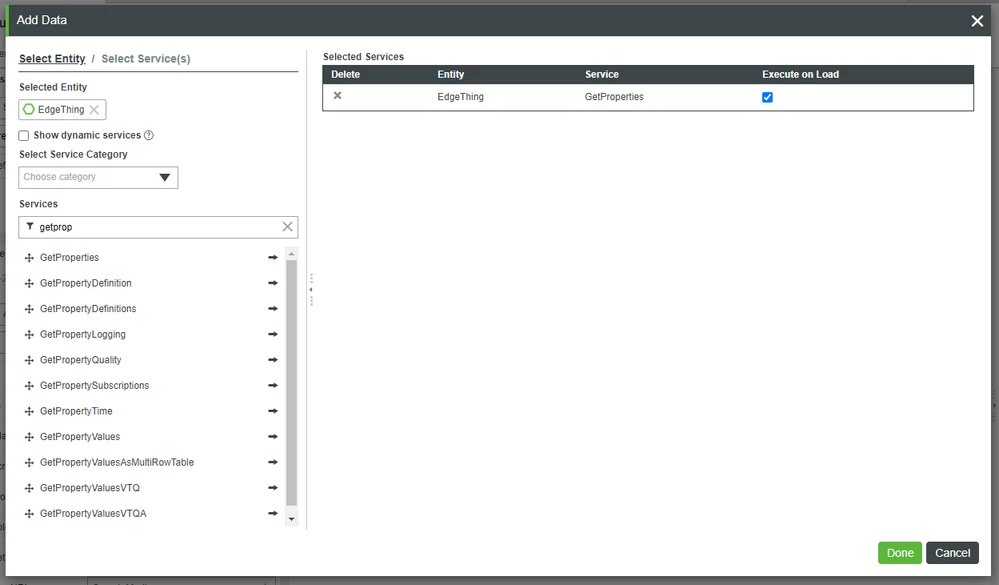
7. In the bottom-right, click Done.
8. On the right, expand GetProperties.
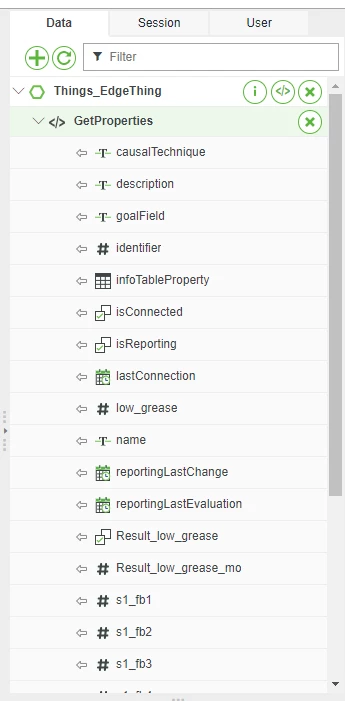
9. At the top, click Save.
Step 5: Bind Data
Now that backend Data is accessible inside Mashup Builder, we need to bind it to the various Widgets.
- Drag-and-drop Data > Things_EdgeThing > GetProperties > s1_fb1 to the top-left Text Field under the s1_fb1 Label Widget.
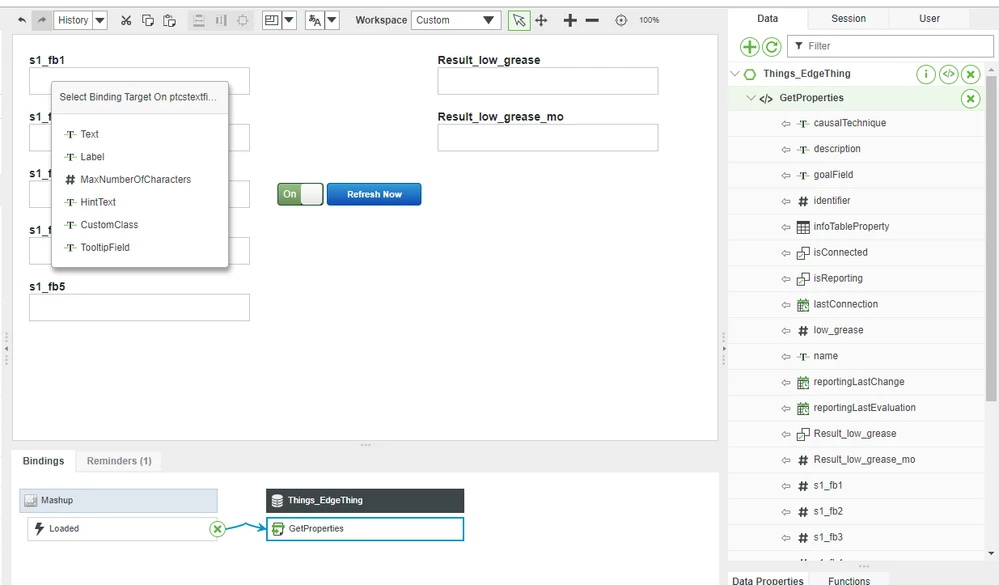
2. On the Select Binding Target pop-up, click Text.
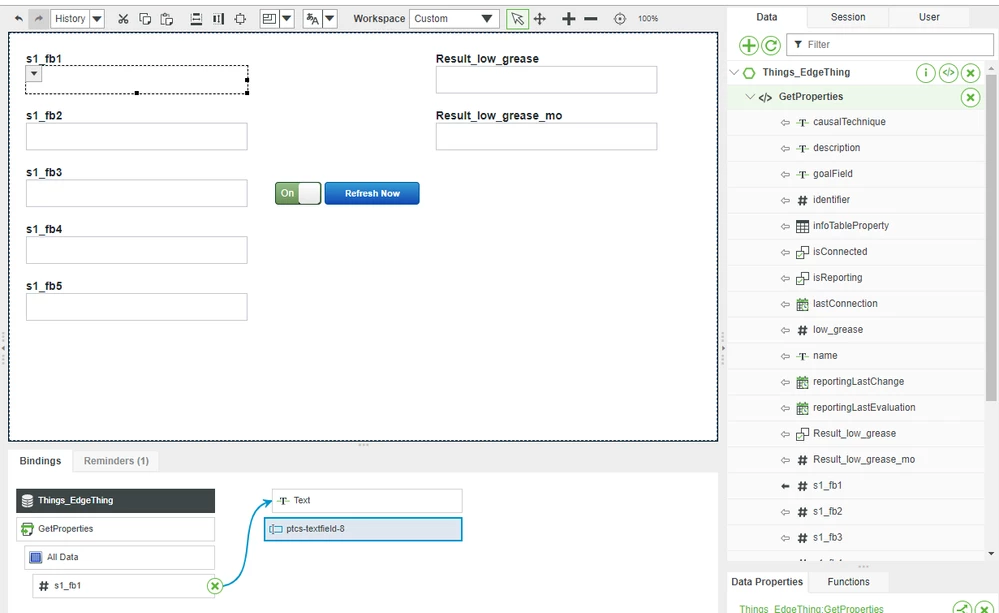
3. Repeat for s1_fb2 through s1_fb5 on the 2nd-5th Text Field Widgets.
4. Drag-and-drop Data > Things_EdgeThing > GetProperties > Result_low_grease to the top-right Text Field under the Result_low_grease Label Widget, and select Text on the Binding pop-up.
5. Repeat for Result_low_grease_mo on the Text Field just below.
6. Click the Auto Refresh Widget to select it.
7. In the bottom-left Properties, set RefreshInterval to 1.
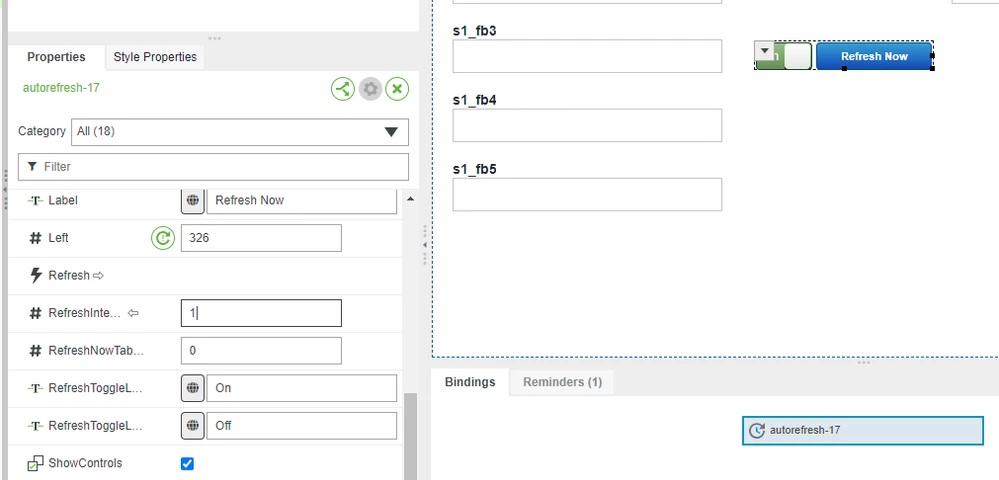
8. With the Auto Refresh Widget still selected, click the top-left corner to reveal a drop-down.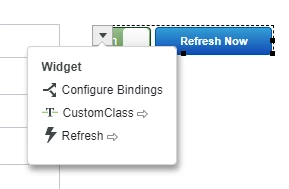
9. Drag-and-drop the Refresh Event onto Things_EdgeThing > GetProperties.
10. On the right, click the GetProperties Mashup Data Service to reveal all of its interactions in the bottom-center Connections window.

11. At the top, click Save.
Step 6: View Mashup
In the last guide, we disabled the Analysis Event after confirming that appropriate analytical jobs were being created and completed whenever new data from our EMS Engine Simulator entered Foundation.
We now need to re-enable that Event so that we can see the results in our Mashup.
1. Return to Analytics > Analytics Manager > Analysis Events.
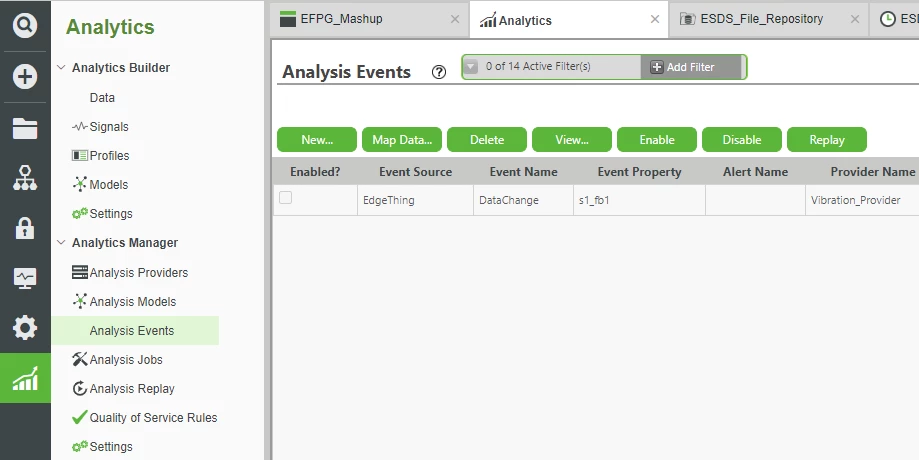
2. Select the Event, and click Enable.

View Analytical Results
With the Analysis Event enabled, we can now view our Mashup to watch engine-failure-predictions be displayed in real time.
1. Return to EFPG_Mashup.
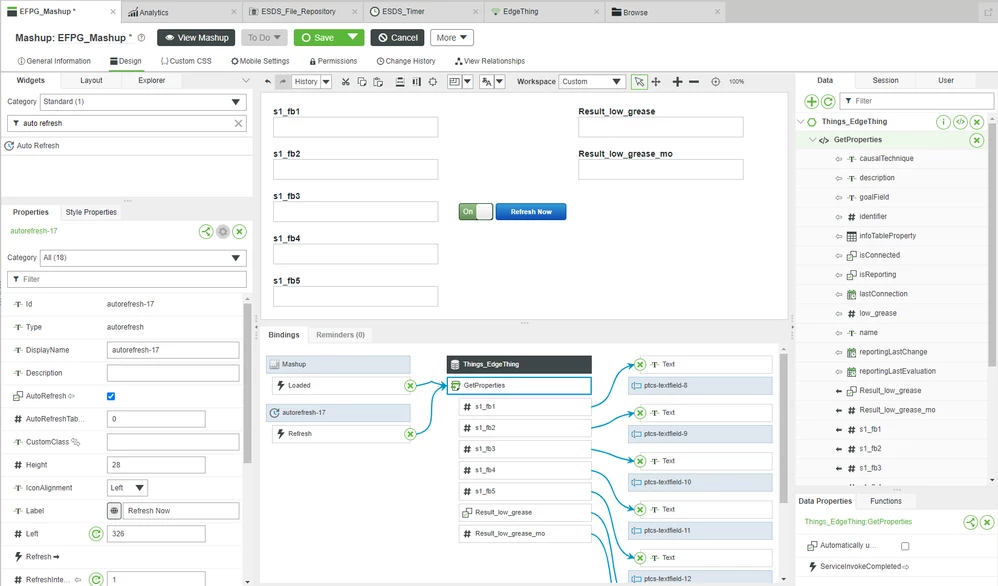
2. At the top, click View Mashup.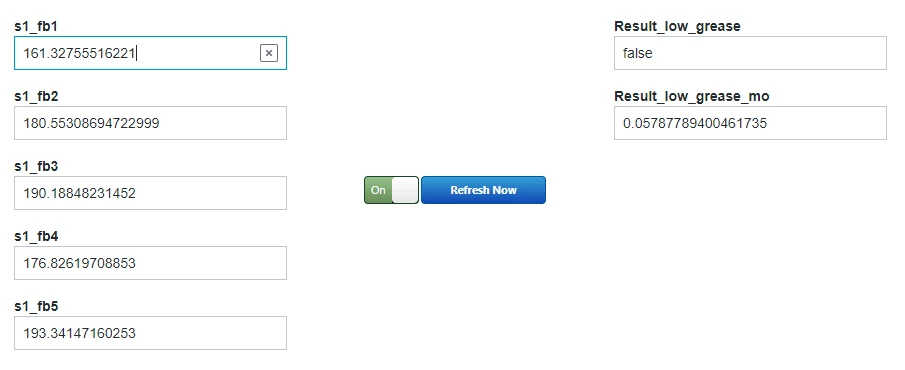
3. Wait and notice how the refresh occurs every second, including both true and false analytics results for the "low grease" condition.
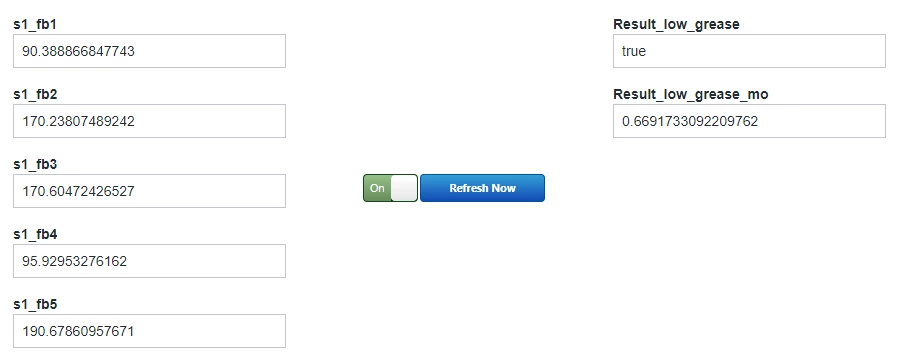
4. When you are satisfied that you have observed enough true/false results, return to Analytics > Analytics Manager > Analysis Events and Disable the event.
Through this Learning Path, you have done all of the following:
- Connect a remote device to Foundation using the Edge MicroServer (EMS)
- Fed relevant product-data to the Foundation backend
- Formatted and exported that data in a manner which Analytics could understand
- Imported that data and used it to build an Analytics Model of your remote device
- Started feeding real-time remote data into the model to achieve immediate failure-prediction results
- Create a GUI to easily visualize those results
You now have a completed Minimum Viable Product (MVP) for a Service Play with MotorCo's new engines.
These new engines may have a known-failure condition, but (because you've instrumented those engines to provide constant data) you can monitor them and predict failures before they actually happen.
This could easily be an up-sell scenario for MotorCo's customers. They could simply purchase the engine. Or they could both purchase the engine and enroll in a service contract where you notified them of impending issues.
What was originally a single-point source of income is now ongoing
Step 7: Next Steps
Congratulations. You've completed the Engine Failure-Prediction GUI guide.
In this guide you learned how to:
- Create a Mashup
- Add Widgets to represent different data
- Bring Backend Data into the Mashup
- Tie data to Widgets
- View Analytical Results in a convenient GUI
The next guide in the Vehicle Predictive Pre-Failure Detection with ThingWorx Platform
learning path is Enhanced Engine Failure Visualization.
Learn More
We recommend the following resources to continue your learning experience:
| Capability | Guide |
| Build | Implement Services, Events, and Subscriptions Guide |
Additional Resources
If you have questions, issues, or need additional information, refer to:
| Resource | Link |
| Community | Developer Community Forum |
| Support | Analytics Manager Help Center |

