
Turn on suggestions
Auto-suggest helps you quickly narrow down your search results by suggesting possible matches as you type.
Showing results for
Please log in to access translation
Turn on suggestions
Auto-suggest helps you quickly narrow down your search results by suggesting possible matches as you type.
Showing results for
Community Tip - You can subscribe to a forum, label or individual post and receive email notifications when someone posts a new topic or reply. Learn more! X
Translate the entire conversation x
Please log in to access translation
Options
- Subscribe to RSS Feed
- Mark Topic as New
- Mark Topic as Read
- Float this Topic for Current User
- Bookmark
- Subscribe
- Mute
- Printer Friendly Page
2D lines on a contour plot
Sep 17, 2012
07:13 AM
- Mark as New
- Bookmark
- Subscribe
- Mute
- Subscribe to RSS Feed
- Permalink
- Notify Moderator
Please log in to access translation
Sep 17, 2012
07:13 AM
2D lines on a contour plot
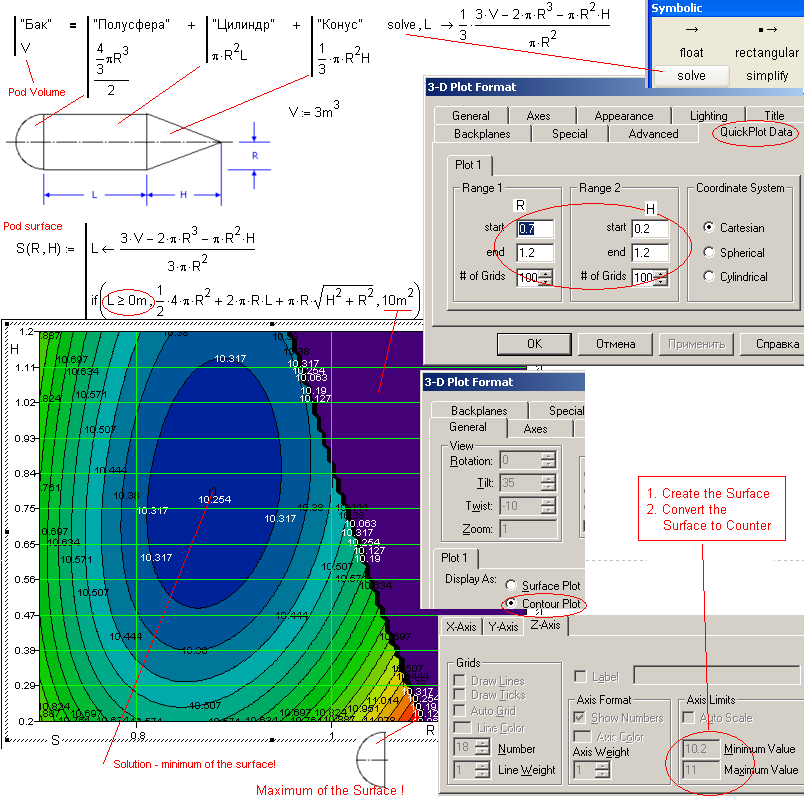
In the MathCAD Prime 2.0, I was trying to add a 2D constraint graph line to a contour plot to indicate the constrained optimum. However, I have no idea on how to do that. Is there a way?
Thank you so much in advance!
Labels:
- Labels:
-
Other
5 REPLIES 5
Sep 17, 2012
08:07 AM
- Mark as New
- Bookmark
- Subscribe
- Mute
- Subscribe to RSS Feed
- Permalink
- Notify Moderator
Please log in to access translation
Sep 17, 2012
08:07 AM
Pavel Kabir wrote:
In the MathCAD Prime 2.0, I was trying to add a 2D constraint graph line to a contour plot to indicate the constrained optimum. However, I have no idea on how to do that. Is there a way?
Thank you so much in advance!
May be this picture help you:
Sep 17, 2012
01:03 PM
- Mark as New
- Bookmark
- Subscribe
- Mute
- Subscribe to RSS Feed
- Permalink
- Notify Moderator
Please log in to access translation
Sep 17, 2012
01:03 PM
Superposition is another way in standard Mathcad; here's an example using CreateSpace ... I haven't got Prime 2.0, so I don't know whether the method will work on it.
Stuart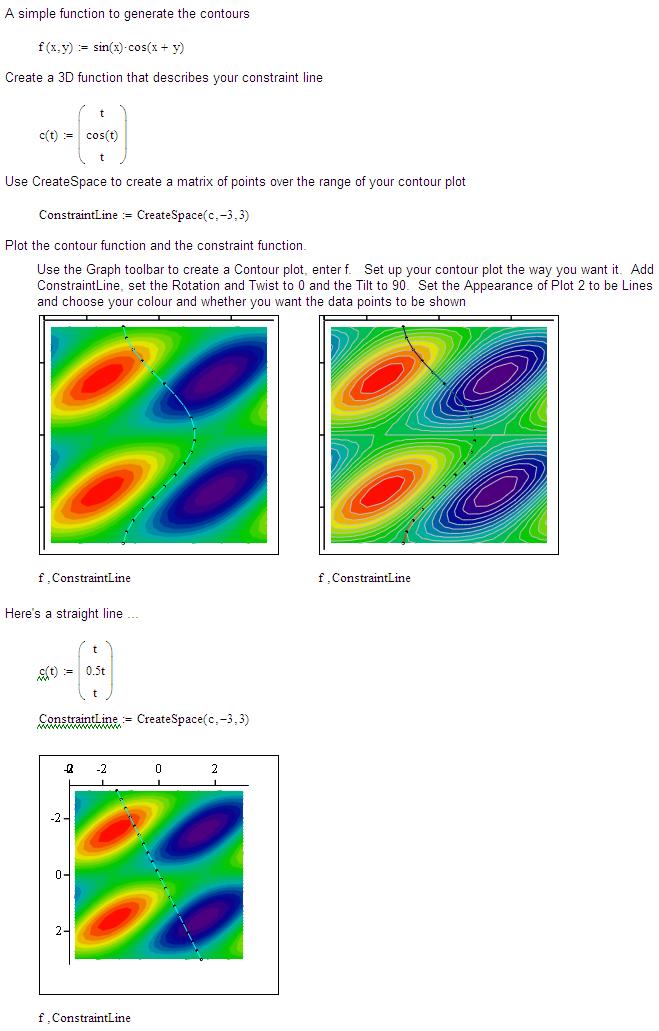
Sep 21, 2012
10:08 PM
- Mark as New
- Bookmark
- Subscribe
- Mute
- Subscribe to RSS Feed
- Permalink
- Notify Moderator
Please log in to access translation
Sep 21, 2012
10:08 PM
Stuart,
Do you know why the y axis is inverted, i.e. the negatives are at the top and the positives are at the bottom?
Sep 22, 2012
03:16 AM
- Mark as New
- Bookmark
- Subscribe
- Mute
- Subscribe to RSS Feed
- Permalink
- Notify Moderator
Please log in to access translation
Sep 22, 2012
03:16 AM
Harvey Hensley wrote:
Stuart,
Do you know why the y axis is inverted, i.e. the negatives are at the top and the positives are at the bottom?
Yes. I was using the joint Australian/Transylvanian protocol (favoured by submariners). Try Twist 90, Tilt 90.
Stuart
Oct 10, 2012
11:42 PM
- Mark as New
- Bookmark
- Subscribe
- Mute
- Subscribe to RSS Feed
- Permalink
- Notify Moderator
Please log in to access translation
Oct 10, 2012
11:42 PM
Stuart,
Just catching up on some stuff. "Twist 90, Tilt 90". Is that the movie script direction for the actor who's just been shot?
H


