Community Tip - Learn all about the Community Ranking System, a fun gamification element of the PTC Community. X
- Subscribe to RSS Feed
- Mark Topic as New
- Mark Topic as Read
- Float this Topic for Current User
- Bookmark
- Subscribe
- Mute
- Printer Friendly Page
3D graphs
- Mark as New
- Bookmark
- Subscribe
- Mute
- Subscribe to RSS Feed
- Permalink
- Notify Moderator
3D graphs
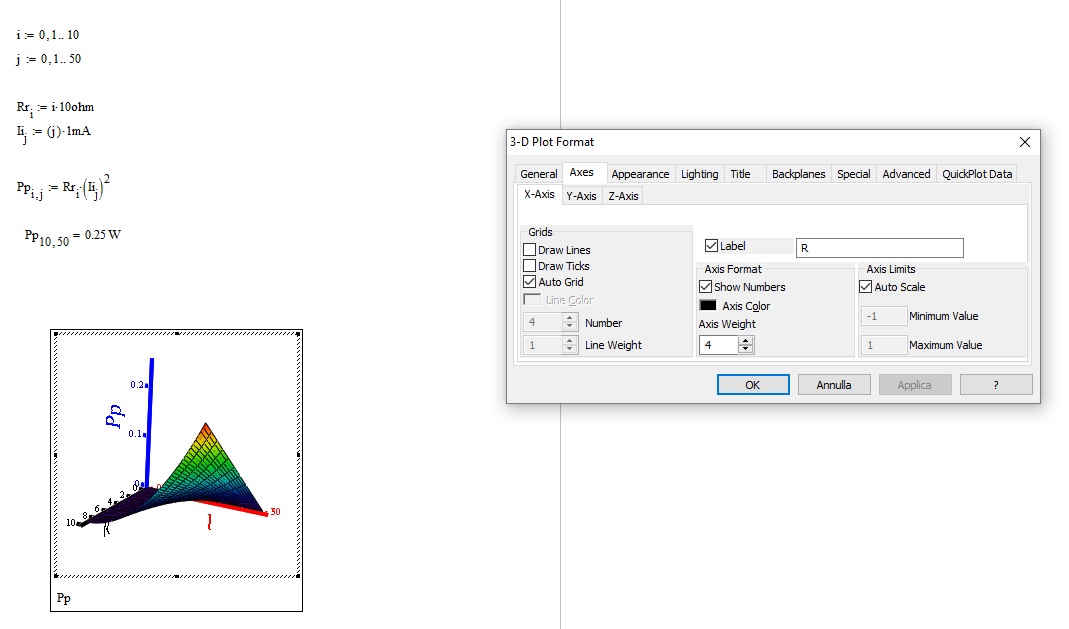
I have 2D matrix (NxM) created with indices which I like to plot in 3D. I wish to change the axes to display not the indices but rather the actual vector that have generated them (with units).
Please see the attachment.
How can I do that?
Solved! Go to Solution.
- Labels:
-
Other
Accepted Solutions
- Mark as New
- Bookmark
- Subscribe
- Mute
- Subscribe to RSS Feed
- Permalink
- Notify Moderator
- Mark as New
- Bookmark
- Subscribe
- Mute
- Subscribe to RSS Feed
- Permalink
- Notify Moderator
Hi Federico,
Click twice quickly on the chart, so as to show the control panel as shown below. With it you can make any changes you want.

- Mark as New
- Bookmark
- Subscribe
- Mute
- Subscribe to RSS Feed
- Permalink
- Notify Moderator
Hello F.M.
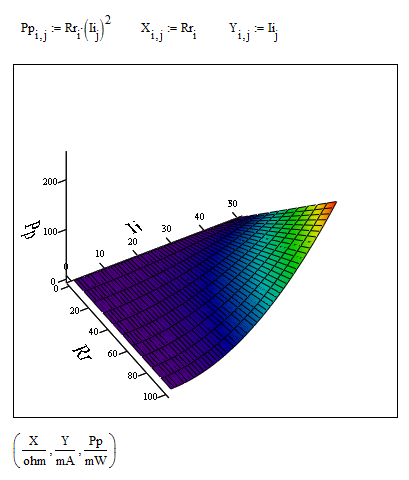
Thanks for the answer....I was looking more to what has been posted below from Richard & Werner.
Best
F
- Mark as New
- Bookmark
- Subscribe
- Mute
- Subscribe to RSS Feed
- Permalink
- Notify Moderator
- Mark as New
- Bookmark
- Subscribe
- Mute
- Subscribe to RSS Feed
- Permalink
- Notify Moderator
Thanks! This is what I was looking for.
Cheers
Federico
- Mark as New
- Bookmark
- Subscribe
- Mute
- Subscribe to RSS Feed
- Permalink
- Notify Moderator
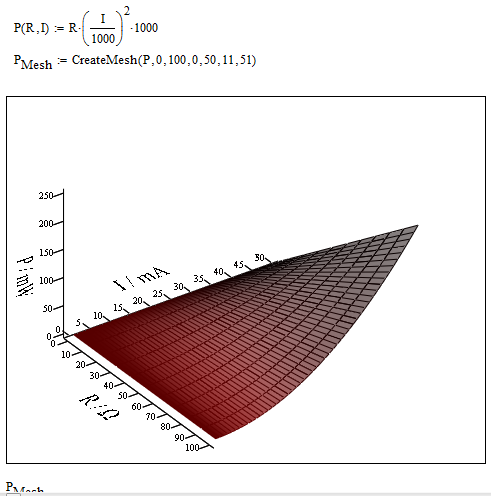
Here is a solution which just uses a function P(R,I) and CreateMesh, but the drawback is, that is has to be used unit-less and to show the results in other than the base units, you have to modify the function, which may be misleading. So you might prefer Richards solution.


- Mark as New
- Bookmark
- Subscribe
- Mute
- Subscribe to RSS Feed
- Permalink
- Notify Moderator
Dear Werner,
Thanks a lot. I indeed find the solution of Richard more practical, but I am not familiar with CreateMesh and I will use your file to get to know this function.
best
Federico


