
Turn on suggestions
Auto-suggest helps you quickly narrow down your search results by suggesting possible matches as you type.
Showing results for
Please log in to access translation
Turn on suggestions
Auto-suggest helps you quickly narrow down your search results by suggesting possible matches as you type.
Showing results for
Community Tip - Learn all about the Community Ranking System, a fun gamification element of the PTC Community. X
Translate the entire conversation x
Please log in to access translation
Options
- Subscribe to RSS Feed
- Mark Topic as New
- Mark Topic as Read
- Float this Topic for Current User
- Bookmark
- Subscribe
- Mute
- Printer Friendly Page
3D graphs
Feb 17, 2017
04:25 AM
- Mark as New
- Bookmark
- Subscribe
- Mute
- Subscribe to RSS Feed
- Permalink
- Notify Moderator
Please log in to access translation
Feb 17, 2017
04:25 AM
3D graphs
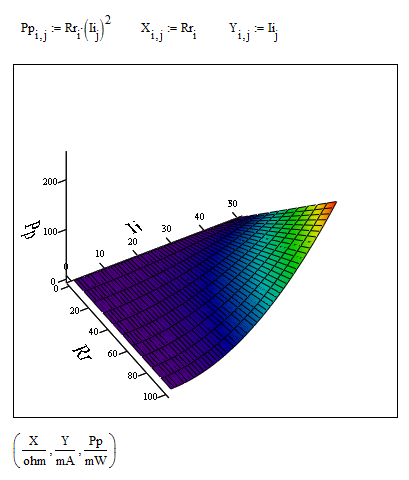
I have 2D matrix (NxM) created with indices which I like to plot in 3D. I wish to change the axes to display not the indices but rather the actual vector that have generated them (with units).
Please see the attachment.
How can I do that?
Solved! Go to Solution.
Labels:
- Labels:
-
Other
ACCEPTED SOLUTION
Accepted Solutions
Feb 17, 2017
11:13 AM
- Mark as New
- Bookmark
- Subscribe
- Mute
- Subscribe to RSS Feed
- Permalink
- Notify Moderator
Please log in to access translation
6 REPLIES 6
Feb 17, 2017
09:01 AM
- Mark as New
- Bookmark
- Subscribe
- Mute
- Subscribe to RSS Feed
- Permalink
- Notify Moderator
Please log in to access translation
Feb 17, 2017
09:01 AM
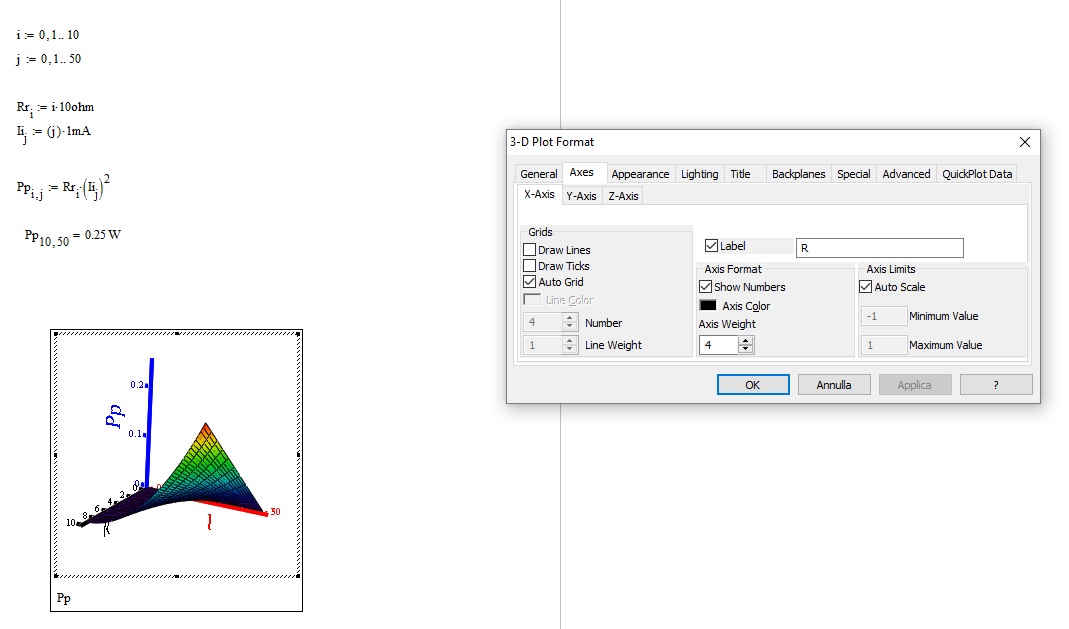
Hi Federico,
Click twice quickly on the chart, so as to show the control panel as shown below. With it you can make any changes you want.
Feb 20, 2017
01:55 AM
- Mark as New
- Bookmark
- Subscribe
- Mute
- Subscribe to RSS Feed
- Permalink
- Notify Moderator
Please log in to access translation
Feb 20, 2017
01:55 AM
Hello F.M.
Thanks for the answer....I was looking more to what has been posted below from Richard & Werner.
Best
F
Feb 17, 2017
11:13 AM
- Mark as New
- Bookmark
- Subscribe
- Mute
- Subscribe to RSS Feed
- Permalink
- Notify Moderator
Please log in to access translation
Feb 20, 2017
01:57 AM
- Mark as New
- Bookmark
- Subscribe
- Mute
- Subscribe to RSS Feed
- Permalink
- Notify Moderator
Please log in to access translation
Feb 20, 2017
01:57 AM
Thanks! This is what I was looking for.
Cheers
Federico
Feb 17, 2017
12:34 PM
- Mark as New
- Bookmark
- Subscribe
- Mute
- Subscribe to RSS Feed
- Permalink
- Notify Moderator
Please log in to access translation
Feb 17, 2017
12:34 PM
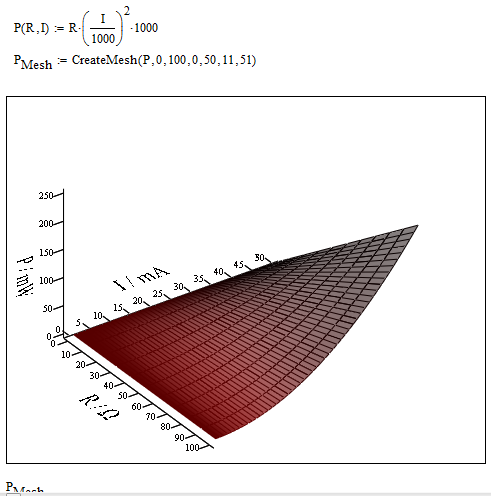
Here is a solution which just uses a function P(R,I) and CreateMesh, but the drawback is, that is has to be used unit-less and to show the results in other than the base units, you have to modify the function, which may be misleading. So you might prefer Richards solution.

Feb 20, 2017
01:58 AM
- Mark as New
- Bookmark
- Subscribe
- Mute
- Subscribe to RSS Feed
- Permalink
- Notify Moderator
Please log in to access translation
Feb 20, 2017
01:58 AM
Dear Werner,
Thanks a lot. I indeed find the solution of Richard more practical, but I am not familiar with CreateMesh and I will use your file to get to know this function.
best
Federico


